1 引言
随着双碳目标的提出,以及近年来我国正在进行的以绿色低碳发展为要求的新型电力系统中长期规划的推进,包含绿色能源的新型配电系统受到越来越多的关注。直流配电系统在保证对用户安全、可靠、连续供电方面发挥着重要作用。对含有绿色能源的直流配电系统的供电能力进行科学的评估与计算,已成为当前城市电网精细化评估与规划工作的关键一环,对于优化网络结构、指导城市电网的规划和运行,具有巨大的经济效益和社会效益[1 ] 。配电网供电能力是指一定供电区域内电网满足N−1条件下最大能满足用户用电的能力,电网供电能力大小取决于换流站站内供电能力和电网供电转移能力[2 ⇓ ⇓ ⇓ -6 ] 。
文献[7 ]提出了电网在满足N−1安全准则条件下进行负荷转移时的供电恢复能力指标,该方法侧重于评估电网不同运行方式的供电恢复能力,没有直接计算电网的最大供电能力;文献[8 ]提出了配电网安全分析的k(N-1+1)安全准则以及基于k(N-1+1)安全准则的故障后供电恢复的重构算法;文献[9 ]提出能够计算N-1安全准则条件下的配电网站内、网络转移供电能力的实用方法,但该方法未严格建立模型。文献[10 ]利用蒙特卡洛抽样法建立了分布式电源输出功率的概率模型,在此基础上分析了辐射型、环形、网状结构对直流配电网供电能力的影响。文献[11 ]提出了系统最大供电能力和系统潜在最大供电能力两个指标的定义、模型和算法,但是并未考虑新型直流配电网中绿色能源的接入对供电能力的影响。
本文以N-1作为系统运行的边界条件,分析直流配电系统供电能力,提出了一种直流配电网供电能力分析方法,并通过一个研究案例验证了其有效性。此外,还研究了光储一体化电站的接入对直流配电网供电能力的影响,以及储能容量在一个光储电站内和多个光储电站之间如何配置可以实现配电网供电能力最大的问题。
2 直流配电网供电能力的计算方法
2.1 联络关系矩阵
以N-1作为系统运行的边界条件,当网络中的某一个主换流器所带的负荷经过联络开关可以转带给另一个主换流器时,称这样的两个主换流器存在联络关系。联络关系可以分为两种形式:站内主换流器之间的联络和站间主换流器之间的联络。以上两种联络关系分别对应换流站内供电能力分析和电网供电转移能力分析。
设直流配电网共有n 座换流站,对换流站进行编号为1,2,…,n 。同时,编号的每座换流站主换流器台数分别为N 1 ,N 2 ,…,Nn 。因此第i 座换流站第j 号主换流器的编号为
(1) ${{N}_{\text{(}i-1)\Sigma }}+j$
式中,N ( i -1)∑ 为前i- 1座换流站内所有主换流器之和。取Nn Σ =N 1 +N 2 +…+Nn ,表示配电网中的主换流器总台数。设Rj 表示第j 号主换流器容量。根据主换流器的联络关系映射得到系统的联络关系矩阵L link 为
(2) ${{L}_{link}}=\left[ \begin{matrix} {{L}_{1,1}} & \cdots & {{L}_{1,j}} & \cdots & {{L}_{1,{{N}_{\Sigma }}}} \\ \vdots & \cdots & \vdots & \cdots & \vdots \\ {{L}_{i,1}} & \cdots & {{L}_{i,j}} & \cdots & {{L}_{i,{{N}_{\Sigma }}}} \\ \vdots & \cdots & \vdots & \cdots & \vdots \\ {{L}_{{{N}_{\Sigma }},1}} & \cdots & {{L}_{{{N}_{\Sigma }},j}} & \cdots & {{L}_{{{N}_{\Sigma }},{{N}_{\Sigma }}}} \\ \end{matrix} \right]$
式中,Li,j 为第i 台主换流器与第j 台主换流器的联络关系,有联络关系时映射为Li,j =1,否则Li,j =0。
矩阵第i 行或第i 列表示该系统中与第i 台主换流器具有联络关系的一组主换流器,称之为以第i 台主换流器为中心的主换流器联络单元。可根据该联络单元的N−1分析结果得到该联络单元各主换流器的最大平均负载率和最大允许负荷。
2.2 联络单元的最大负载率分析
在L link 所示主换流器联络关系矩阵中,由第i 行向量可确定与第i 台主换流器有联络关系的主换流器最大负载情况,依此矩阵可定义如下联络单元主换流器最大负载率矩阵
(3) $T=\left[ \begin{matrix} {{T}_{1,1}} & \cdots & {{T}_{1,j}} & \cdots & {{T}_{1,{{N}_{\Sigma }}}} \\ \vdots & \cdots & \vdots & \cdots & \vdots \\ {{T}_{i,1}} & \cdots & {{T}_{i,j}} & \cdots & {{T}_{i,{{N}_{\Sigma }}}} \\ \vdots & \cdots & \vdots & \cdots & \vdots \\ {{T}_{{{N}_{\Sigma }},1}} & \cdots & {{T}_{{{N}_{\Sigma }},j}} & \cdots & {{T}_{{{N}_{\Sigma }},{{N}_{\Sigma }}}} \\ \end{matrix} \right]$
以第i 行为例说明:若该行非零元素为Qi 个,则表明该联络单元的主换流器台数为Qi ,可定义出该联络单元各台主换流器的平均负载率Ti,j 。
当第i 台主换流器与第j 台主换流器没有联络关系时,Li,j 及Ti,j 等于0,表示以第j 台主换流器与以第i 台主换流器为中心的联络单元不存在联络关系,N−1情况下无法参与转带联络单元的N−1负荷;当第i 台主换流器与第j 台主换流器存在联络关系时,Ti,j 可根据第i 台主换流器的联络情况考虑第j 台主换流器发生N−1时均分N−1负荷得到,则有
(4) ${{T}_{i,j}}=\frac{\sum\limits_{j=1}^{_{{{N}_{\Sigma }}}}{{{L}_{i,j}}{{R}_{j}}-{{R}_{i}}}}{\sum\limits_{j=1}^{_{{{N}_{\Sigma }}}}{{{L}_{i,j}}{{R}_{j}}}}$
矩阵T j 与不同联络单元的其他主换流器联络时允许达到的最大运行负载率具有不同的数值,表现为T j 列不同行的元素具有不同的值,为了保证主换流器j 在不同联络情况下都满足“N-1”,主换流器j 的最大允许负载率Tj 只能按矩阵的列最小值确定,即
(5) ${{T}_{j}}=\underset{1\le i\le {{N}_{\Sigma }},{{T}_{i,j}}\ne 0}{\mathop{\min }}\,\left\{ {{T}_{i,j}} \right\}$
2.3 光伏接入后直流配电网联络关系矩阵、最大负载率分析
直流配电网发展的驱动力之一为更加高效地实现新能源接入。相比于传统换流站,新能源电站的出力受到环境条件的影响,具有随机性[12 ] 。
本节以光伏电站接入直流配电网为例分析新能源接入对系统供电能力的影响。
(1) 光伏电站出力建模。光伏的出力与光照强度、光电转换效率以及光伏电池板总面积相关。在光照强度一定的情况下,光伏的出力为
(6) ${{P}_{PV}}=r\eta A$
式中,P PV 为光伏出力(W);r 为光照强度(W/m2 );η 为光电转换效率;A 为光伏电池板总面积(m2 )。
在特定时间段内太阳光照强度近似服从Beta分布[13 -14 ] ,结合光伏出力与光照强度的关系,可得光伏出力的概率函数为
(7) $f\left( {{P}_{PV}} \right)=\frac{\Gamma \left( \alpha +\beta \right)}{{{P}_{PVmax}}\Gamma \left( \alpha \right)\Gamma \left( \beta \right)}{{\left( \frac{{{P}_{PV}}}{{{P}_{PVmax}}} \right)}^{\alpha -1}}{{\left( 1-\frac{{{P}_{PV}}}{{{P}_{PVmax}}} \right)}^{\beta -1}}$
式中,P PVmax =r max ηA 为光伏发电的最大输出功率;r max 为最大光照强度;α 、β 为分布参数;Γ 为Gamma函数。考虑到光伏出力的随机性,根据光伏出力的概率密度函数,采用蒙特卡洛法对选取的光伏出力求取平均值,得到等价的光伏供电能力。
(2) 算法更新。设N D∑ 为直流配电网的分布式光伏电站的总台数,则系统的联络关系矩阵可更新为
(8) ${{L}_{link}}=\left[ \begin{matrix} {{L}_{1,1}} & \cdots & {{L}_{1,j}} & \cdots & {{L}_{1,{{N}_{n\Sigma }}}} \\ \vdots & \cdots & \vdots & \cdots & \vdots \\ {{L}_{i,1}} & \cdots & {{L}_{i,j}} & \cdots & {{L}_{i,{{N}_{n\Sigma }}}} \\ \vdots & \cdots & \vdots & \cdots & \vdots \\ {{L}_{{{N}_{n\Sigma }},1}} & \cdots & {{L}_{{{N}_{n\Sigma }},j}} & \cdots & {{L}_{{{N}_{n\Sigma }},{{N}_{n\Sigma }}}} \\ \end{matrix}\begin{matrix} {{L}_{1,{{N}_{n\Sigma }}+1}} & \cdots & {{L}_{1,{{N}_{\text{n}\Sigma }}+k}} & \cdots & {{L}_{1,{{N}_{n\Sigma }}+{{N}_{D\Sigma }}}} \\ \vdots & \cdots & \vdots & \cdots & \vdots \\ {{L}_{i,{{N}_{n\Sigma }}+1}} & \cdots & {{L}_{i,{{N}_{\text{n}\Sigma }}+k}} & \cdots & {{L}_{i,{{N}_{n\Sigma }}+{{N}_{D\Sigma }}}} \\ \vdots & \cdots & \vdots & \cdots & \vdots \\ {{L}_{{{N}_{n\Sigma }},{{N}_{n\Sigma }}+1}} & \cdots & {{L}_{{{N}_{n\Sigma }},{{N}_{\text{n}\Sigma }}+k}} & \cdots & {{L}_{{{N}_{n\Sigma }},{{N}_{n\Sigma }}+{{N}_{D\Sigma }}}} \\ \end{matrix} \right]$
则Li,j 为第i 台主换流器与第j 台主换流器或DG的联络关系,有联络关系时Li,j =1,否则Li,j =0。每一行对应一个主换流器联络单元。
(9) ${{T}_{i,j}}=\frac{\sum\limits_{j=1}^{_{{{N}_{\left( x-1 \right)\Sigma }}}}{{{L}_{i,j}}{{R}_{j}}+\sum\limits_{j={{N}_{\left( x-1 \right)\Sigma }}+1}^{_{{{N}_{x\Sigma }}}}{{{R}_{j}}-{{R}_{i}}}+\sum\limits_{j={{N}_{x\Sigma +1}}}^{_{{{N}_{\text{n}\Sigma }}}}{{{L}_{i,j}}{{R}_{j}}}+\sum\limits_{j=1}^{_{{{N}_{D\Sigma }}}}{{{R}_{Dj}}{{L}_{i,{{N}_{n\Sigma }}+j}}}}}{\sum\limits_{j=1}^{_{{{N}_{n\Sigma }}{{+}_{{{N}_{D\Sigma }}}}}}{{{L}_{i,j}}{{R}_{j}}}}$
式(9)表示当第i 台主换流器发生故障时,由其他正常运行的联络主换流器及联络DG将共同转带“N-1”负荷。
系统内各个主换流器的最大允许负载率可按照式(5)分析。
2.4 系统综合供电能力
通过上述分析,计算得出每个主换流器的最大允许负载率,进而得出该网络的最大供电能力,即各台主换流器最大允许负荷之和
(10) ${{S}_{N-1}}=\sum\limits_{i=1}^{_{{{N}_{\Sigma }}}}{{{T}_{i}}_{\left( N-1 \right)}\times {{R}_{i}}}$
(11) ${{T}_{\text{avg}}}\text{=}\frac{{{S}_{N-1}}}{{{S}_{N}}}\cdot 100\%$
3 供电能力仿真分析
3.1 无光伏接入的直流配电网供电能力计算
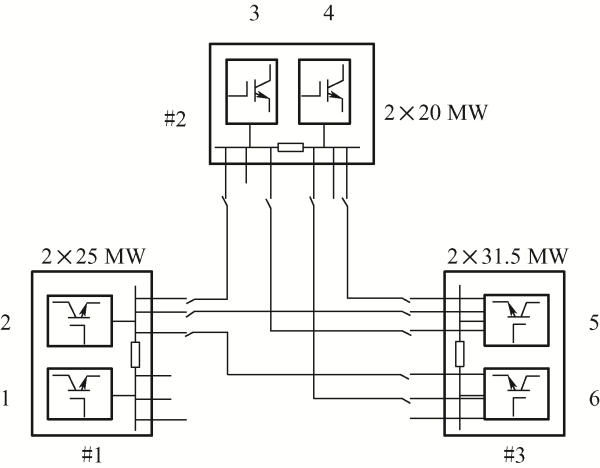
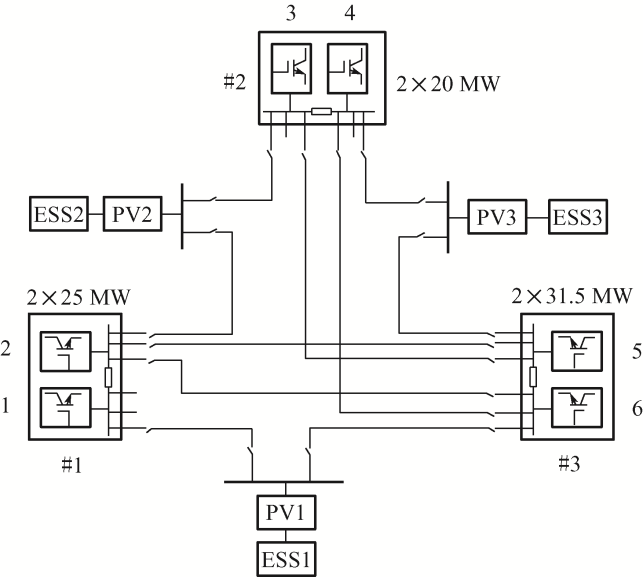
本节研究了一个三端直流配电网络,采用环形拓扑。如图1 所示,该直流配电网共有3个换流站、6个换流器。换流站编号分别为1、2、3,换流器编号为1、2、3、4、5、6,容量分别为25 MW、25 MW、20 MW、20 MW、31.5 MW、31.5 MW。
图1
(12) $\boldsymbol{L}_{\text {link }}=\left[\begin{array}{ccccc} L_{1,1} & \cdots & L_{1, j} & \cdots & L_{1,6} \\ \vdots & \cdots & \vdots & \cdots & \vdots \\ L_{i, 1} & \cdots & L_{i, j} & \cdots & L_{i, 6} \\ \vdots & \cdots & \vdots & \cdots & \vdots \\ L_{6,1} & \cdots & L_{6, j} & \cdots & L_{6,6} \end{array}\right]=\left[\begin{array}{cccccc} 1 & 1 & 0 & 0 & 0 & 1 \\ 1 & 1 & 1 & 0 & 1 & 1 \\ 0 & 1 & 1 & 1 & 1 & 0 \\ 0 & 0 & 1 & 1 & 1 & 1 \\ 0 & 1 & 1 & 1 & 1 & 1 \\ 1 & 1 & 0 & 1 & 1 & 1 \end{array}\right]$
以式(12)中L link 矩阵第3行为例进行说明,第3行有4个非零元素分别代表2 、3 、4 、5 号主换流器,这4台主换流器组成一个联络单元。为满足N-1的要求,可求得主换流器的负载率矩阵为
(13) $\begin{matrix} T=\left[ \begin{matrix} {{T}_{1,1}} & \cdots & {{T}_{1,j}} & \cdots & {{T}_{1,6}} \\ \vdots & \cdots & \vdots & \cdots & \vdots \\ {{T}_{i,1}} & \cdots & {{T}_{i,j}} & \cdots & {{T}_{i,6}} \\ \vdots & \cdots & \vdots & \cdots & \vdots \\ {{T}_{6,1}} & \cdots & {{T}_{6,j}} & \cdots & {{T}_{6,6}} \\ \end{matrix} \right]= \\ \left[ \begin{matrix} 0.693\ 3 & 0.693\ 3 & 0 & 0 & 0 & 0.693\ 3 \\ 0.812\ 0 & 0.812\ 0 & 0.812\ 0 & 0 & 0.812\ 0 & 0.812\ 0 \\ 0 & 0.792\ 7 & 0.792\ 7 & 0.792\ 7 & 0.792\ 7 & 0 \\ 0 & 0 & 0.805\ 8 & 0.805\ 8 & 0.805\ 8 & 0.805\ 8 \\ 0 & 0.753\ 9 & 0.753\ 9 & 0.753\ 9 & 0.753\ 9 & 0.753\ 9 \\ 0.763\ 2 & 0.763\ 2 & 0 & 0.763\ 2 & 0.763\ 2 & 0.763\ 2 \\ \end{matrix} \right] \\ \end{matrix}$
在式(13)所示的T T 1,6 =0.693 3。同时,在矩阵第2行中,6号主换流器与1号主换流器、2号主换流器、3号主换流器、5号主换流器也形成了一组联络单元,这组联络关系中的5台主换流器均需要满足“N−1”,即T 2,6 =0.812 0,按照此分析方法可以计算出T 4,6 =0.805 8,T 5,6 =0.753 9,T 6,6 =0.763 2。为保证第6台主换流器在各种组合联络情况下都满足N−1要求,确定其实际最大允许负载率为T
最后计算出拓扑中6台主换流器的最大允许负载率列向量T N −1 为
(14) $\begin{array} \boldsymbol{T}_{N-1}=\left[\begin{array}{llllll} T_{1(N-1)} & T_{2(N-1)} & T_{3(N-1)} & T_{4(N-1)} & T_{5(N-1)} & T_{6(N-1)} \end{array}\right]^{\mathrm{T}}= \\ \left[\begin{array}{llllll} 69.33 \% & 69.33 \% & 75.39 \% & 75.39 \% & 75.39 \% & 75.39 \% \end{array}\right]^{\mathrm{T}} \end{array}$
(15) ${{S}_{N-1}}=\sum\limits_{i=1}^{6}{{{T}_{i}}_{\left( N-1 \right)}\times {{R}_{i}}}\text{=110}\text{.40}\ \text{MW}$
(16) ${{T}_{\text{avg}}}\text{=}\frac{{{S}_{N-1}}}{{{S}_{N}}}\cdot 100\%=72.16%$
3.2 光伏接入对直流配电网供电能力的影响
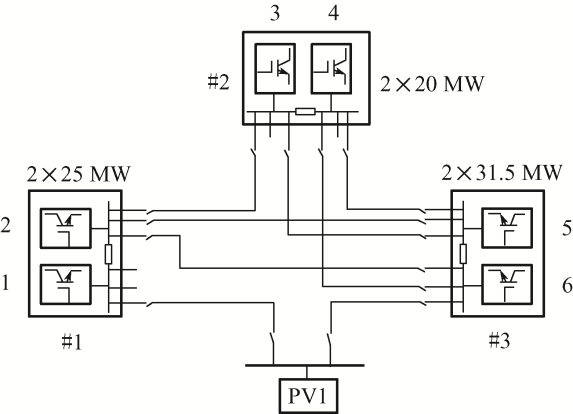
如图2 可知,在三端直流配电网络中的1、3换流站之间加入光伏电站PV1,将其编号为7,此时,由各主换流器之间的连接关系可求关系矩阵为
(17) $\begin{matrix} {{L}_{link}}=\left[ \begin{matrix} {{L}_{1,1}} & \cdots & {{L}_{1,j}} & \cdots & {{L}_{1,7}} \\ \vdots & \cdots & \vdots & \cdots & \vdots \\ {{L}_{i,1}} & \cdots & {{L}_{i,j}} & \cdots & {{L}_{i,7}} \\ \vdots & \cdots & \vdots & \cdots & \vdots \\ {{L}_{7,1}} & \cdots & {{L}_{7,j}} & \cdots & {{L}_{7,7}} \\ \end{matrix} \right]= \\ \left[ \begin{matrix} 1 & 1 & 0 & 0 & 0 & 1 & 1 \\ 1 & 1 & 1 & 0 & 1 & 1 & 0 \\ 0 & 1 & 1 & 1 & 1 & 0 & 0 \\ 0 & 0 & 1 & 1 & 1 & 1 & 0 \\ 0 & 1 & 1 & 1 & 1 & 1 & 0 \\ 1 & 1 & 0 & 1 & 1 & 1 & 1 \\ 1 & 0 & 0 & 0 & 0 & 1 & 1 \\ \end{matrix} \right] \\ \end{matrix}$
图2
图2
接入光伏电站的直流配电网主换流器互联关系简化示意图
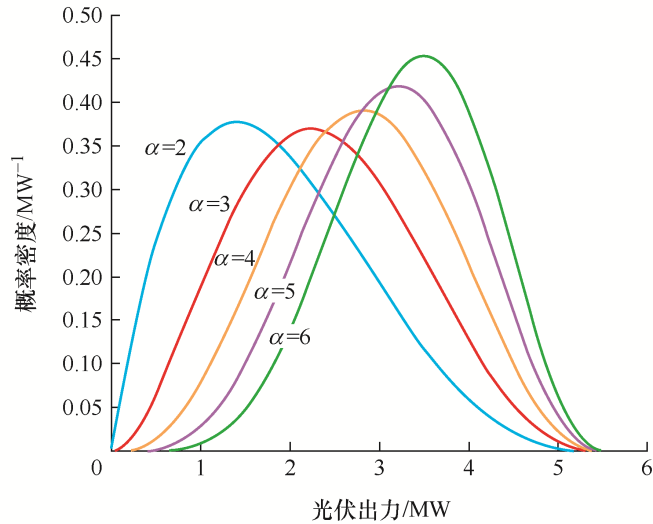
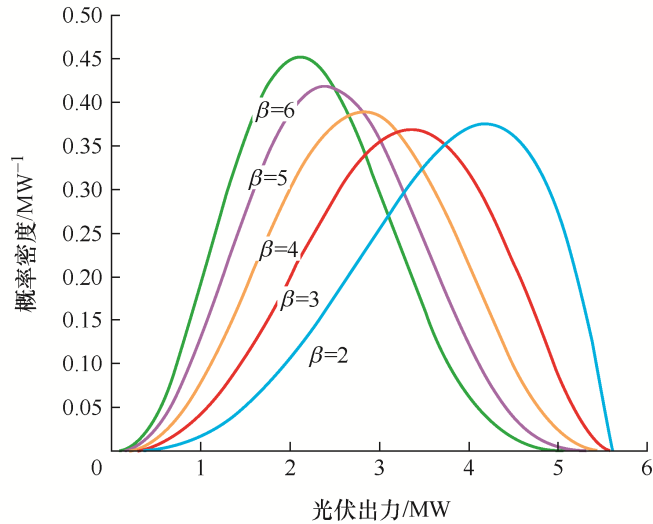
光伏的输出受光强、光电转换效率、光伏板总面积的影响。在一定时间内,太阳光强度近似符合Beta分布。图3 、图4 展示了考虑太阳光强度的Beta分布,在分布参数α 、β 取不同值时,光伏出力的概率密度曲线。可以看出光伏输出功率是随机的,且最大光伏出力P PVmax =5.6 MW。本算例取光伏电站出力为3.6 MW。
图3
图3
α 取不同数值时的光伏出力概率密度曲线(β =4)
图4
图4
β 取不同数值时的光伏出力概率密度曲线(α =4)
为满足N-1的要求,可求得主换流器的负载率矩阵T T N −1 分别为
(18) $T=\left[ \begin{matrix} {{T}_{1,1}} & \cdots & {{T}_{1,j}} & \cdots & {{T}_{1,7}} \\ \vdots & \cdots & \vdots & \cdots & \vdots \\ {{T}_{i,1}} & \cdots & {{T}_{i,j}} & \cdots & {{T}_{i,7}} \\ \vdots & \cdots & \vdots & \cdots & \vdots \\ {{T}_{7,1}} & \cdots & {{T}_{7,j}} & \cdots & {{T}_{7,7}} \\ \end{matrix} \right]=\left[ \begin{matrix} 0.706\ 2 & 0.706\ 2 & 0 & 0 & 0 & 0.706\ 2 & 0.706\ 2 \\ 0.812\ 0 & 0.812\ 0 & 0.812\ 0 & 0 & 0.812\ 0 & 0.812\ 0 & 0 \\ 0 & 0.792\ 7 & 0.792\ 7 & 0.792\ 7 & 0.792\ 7 & 0 & 0 \\ 0 & 0 & 0.812\ 4 & 0.812\ 4 & 0.812\ 4 & 0.812\ 4 & 0.812\ 4 \\ 0 & 0.760\ 6 & 0.760\ 6 & 0.760\ 6 & 0.760\ 6 & 0.760\ 6 & 0.760\ 6 \\ 0.769\ 4 & 0 & 0 & 0.769\ 4 & 0.769\ 4 & 0.769\ 4 & 0.769\ 4 \\ 0.967\ 7 & 0 & 0 & 0.967\ 7 & 0.967\ 7 & 0.967\ 7 & 0.967\ 7 \\ \end{matrix} \right]$
(19) $\begin{array}{l} \boldsymbol{T}_{N-1}=\left[\begin{array}{lllllll} T_{1(N-1)} & T_{2(N-1)} & T_{3(N-1)} & T_{4(N-1)} & T_{5(N-1)} & T_{6(N-1)} & T_{7(N-1)} \end{array}\right]^{\mathrm{T}}= \\ {\left[\begin{array}{lllllll} 70.62 \% & 70.62 \% & 76.06 \% & 76.06 \% & 76.06 \% & 76.06 \% & 76.06 \% \end{array}\right]^{\mathrm{T}}} \\ \end{array}$
(20) ${{S}_{N-1}}=\sum\limits_{i=1}^{7}{{{T}_{i}}_{\left( N-1 \right)}\times {{R}_{i}}}\text{=114}\text{.49}\ \text{MW}$
(21) ${{T}_{\text{avg}}}\text{=}\frac{{{S}_{N-1}}}{{{S}_{N}}}\cdot 100\%=73.11\%$
将式(15)、(16)与式(20)、(21)进行对比可以看出,接入光伏后的直流配电网供电能力比未接入时有了明显提高。
3.3 光储一体化电站接入对直流配电网供电能力的影响
直流配电网中储能的加入可以起到平抑光伏发电出力波动性的作用[15 ⇓ ⇓ ⇓ -19 ] ,如图5 所示。
图5
图5
含光储电站的直流配电网主换流器互联关系简化示意图
在第3.1节三端直流配电网络的基础上添加3个光储一体化电站,采用环形拓扑。光储电站PV1、PV2、PV3分别作为7、8、9号主换流器,则主换流器联络矩阵可更新为
(22) ${{L}_{link}}\text{=}\left[ \begin{matrix} 1 & 1 & 0 & 0 & 0 & 1 & 1 & 0 & 0 \\ 1 & 1 & 1 & 0 & 1 & 1 & 0 & 1 & 0 \\ 0 & 1 & 1 & 1 & 1 & 0 & 0 & 1 & 0 \\ 0 & 0 & 1 & 1 & 1 & 1 & 0 & 0 & 1 \\ 0 & 1 & 1 & 1 & 1 & 1 & 0 & 0 & 1 \\ 1 & 1 & 0 & 1 & 1 & 1 & 1 & 0 & 0 \\ 1 & 0 & 0 & 0 & 0 & 1 & 1 & 0 & 0 \\ 0 & 1 & 1 & 0 & 0 & 0 & 0 & 1 & 0 \\ 0 & 0 & 0 & 1 & 1 & 0 & 0 & 0 & 1 \\ \end{matrix} \right]$
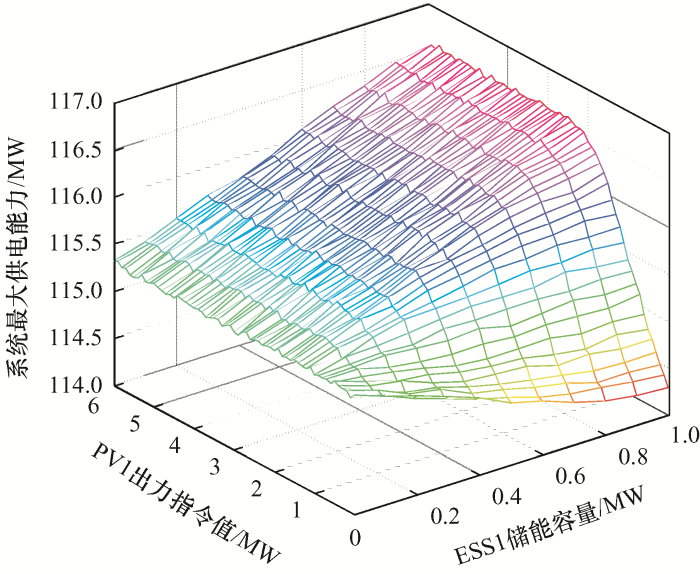
图6 为光伏电站PV1出力指令值及ESS1储能容量分别在一定区间波动时对该直流配电网供电能力的影响。由图6 可知,加入光储充电站后直流配电网的供电能力比无光储电站的情况下供电能力(110.40 MW)有了明显提升。并且在光伏电站出力大于0.6 MW的情况下,在该配电网配置储能容量范围内,储能数值越大,对直流配电网供电能力的提升作用越显著。
图6
3.4 储能容量在不同光储电站之间分配对直流配电网供电能力的影响
本文研究的直流配电网共配置3个光储电站,因此在3个光储电站中储能容量如何分配,以求得对直流配电网供电能力提升作用最大值得研究[20 ] 。
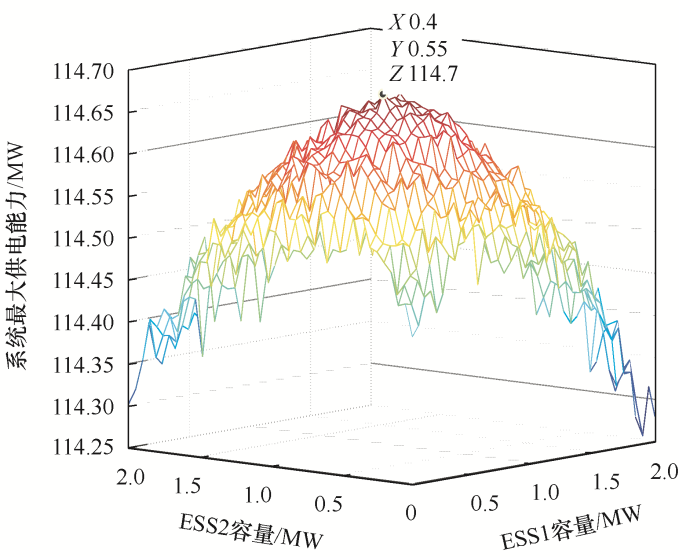
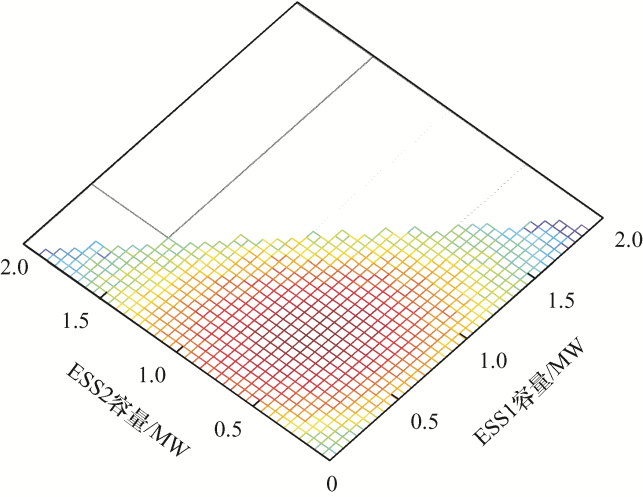
考虑实际光储电站的储能容量配置原则,设定图7 、图8 所示的3个光储电站总储能容量为2 MW时,即P ESS1 +P ESS2 +P ESS3 =2 MW,通过循环遍历计算,得到该直流配电网取得最大供电能力的储能分配情况。由图8 可知,P ESS1 、P ESS2 取值在0.5 MW附近,P ESS3 取值在1 MW附近时,该直流配电网的系统最大供电能力取得最大值。
图7
图7
储能容量在3个光储一体化电站之间分配时的系统最大供电能力正视图
图8
图8
储能容量在3个光储一体化电站之间分配时的系统最大供电能力俯视图
4 结论
本文提出了一种直流配电网供电能力分析方法,研究了光储一体化电站的接入对该直流配电网供电能力的影响,以及储能容量在不同光储电站之间分配对直流配电网供电能力的影响,通过一个研究案例验证了其有效性。针对本文研究的直流配电网,通过供电能力计算得出以下结论。
(1) 接入光伏并考虑了光伏出力的随机性特征,直流配电网供电能力有了显著提升。
(2) 直流配电网接入光储电站之后,在一定光伏出力范围内,储能容量越大,对供电能力的提升作用也越显著,但需要考虑储能的投资费用,具体配置多少储能容量可以实现经济性、技术性的最优仍需要进一步研究。
(3) 为了达到配电网供电能力最大,考虑到配电网的主换流器容量、连接方式、光伏出力等因素,同一个配电网中的不同光储电站配置的储能容量也应相互配合、综合分析。对于不同配电网,储能之间的容量分配需要针对性计算,这种储能分配计算方法还需要进一步优化。
参考文献
View Option
[1]
韩民晓 , 谢文强 , 曹文远 , 等 . 中压直流配电网应用场景与系统设计
[J]. 电力系统自动化 , 2019 , 43 (23 ):2 -11 ,89.
[本文引用: 1]
HAN Minxiao XIE Wenqiang CAO Wenyuan et al. Medium voltage DC power distribution network application scenario and system design
[J]. Automation of Electric Power Systems , 2019 , 43 (23 ):2 -11 ,89.
[本文引用: 1]
[2]
刘健 , 殷强 , 张志华 . 配电网分层供电能力评估与分析
[J]. 电力系统自动化 , 2014 , 38 (5 ):44 -49 ,77.
[本文引用: 1]
LIU Jian YIN Qiang ZHANG Zhihua Evaluation and analysis of hierarchical power supply capability of distribution network
[J]. Automation of Electric Power Systems , 2014 , 38 (5 ):44 -49 ,77.
[本文引用: 1]
[3]
郭焱林 , 刘俊勇 , 魏震波 , 等 . 配电网供电能力研究综述
[J]. 电力自动化设备 , 2018 , 38 (1 ):33 -43 .
[本文引用: 1]
GUO Yanlin LIU Junyong WEI Zhenbo et al. Review on power supply capability of distribution network
[J]. Electric Power Automation Equipment , 2018 , 38 (1 ):33 -43 .
[本文引用: 1]
[4]
李振坤 , 陈星莺 , 刘皓明 , 等 . 配电网供电能力的实时评估分析
[J]. 电力系统自动化 , 2009 , 33 (6 ):36 -39 ,62.
[本文引用: 1]
LI Zhenkun CHEN Xingying LIU Haoming et al. Real-time evaluation and analysis of power supply capacity of distribution network
[J]. Automation of Electric Power Systems , 2009 , 33 (6 ):36 -39 ,62.
[本文引用: 1]
[5]
肖峻 , 谷文卓 , 郭晓丹 , 等 . 配电系统供电能力模型
[J]. 电力系统自动化 , 2011 , 35 (24 ):47 -52 .
[本文引用: 1]
XIAO Jun GU Wenzhuo GUO Xiaodan et al. Power supply capability model of distribution system
[J]. Automation of Electric Power Systems , 2011 , 35 (24 ):47 -52 .
[本文引用: 1]
[6]
肖峻 , 张婷 , 张跃 , 等 . 基于最大供电能力的配电网规划理念与方法
[J]. 中国电机工程学报 , 2013 , 33 (10 ):106 -113 .
[本文引用: 1]
XIAO Jun ZHANG Ting ZHANG Yue et al. Distribution network planning concept and method based on maximum power supply capacity
[J]. Proceedings of the CSEE , 2013 , 33 (10 ):106 -113 .
[本文引用: 1]
[7]
王成山 , 罗凤章 , 肖峻 , 等 . 基于主换流器互联关系的配电系统供电能力计算方法
[J]. 中国电机工程学报 , 2009 , 29 (13 ):86 -91 .
[本文引用: 1]
WANG Chengshan LUO Fengzhang XIAO Jun et al. Power supply capacity calculation method of distribution system based on main transformer interconnection
[J]. Proceedings of the CSEE , 2009 , 29 (13 ):86 -91 .
[本文引用: 1]
[8]
张雪梅 , 郭志忠 . 配电网安全分析的k(n-1+1)准则
[J]. 继电器 , 2001 , 29 (10 ):9 -12 ,37.
[本文引用: 1]
ZHANG Xuemei GUO Zhizhong k(n-1+1) criterion for distribution network security analysis
[J]. Power System Protection and Control , 2001 , 29 (10 ):9 -12 ,37.
[本文引用: 1]
[9]
LUO Fengzhang WANG Chengshan XIAO Jun et al. Rapid evaluation method for power supply capability of urban distribution system based on N-1 contingency analysis of main-transformers
[J]. International Journal of Electrical Power and Energy Systems , 2010 , 32 (10 ):1063 -1068 .
DOI:10.1016/j.ijepes.2010.01.021
URL
[本文引用: 1]
[10]
叶莘 , 韦钢 , 马雷鹏 , 等 . 含分布式电源的直流配电网供电能力评估
[J]. 电力系统自动化 , 2017 , 41 (9 ):58 -64 .
[本文引用: 1]
YE Zi WEI Gang MA Leipeng et al. Power supply capability evaluation of DC distribution network with distributed power supply
[J]. Automation of Electric Power Systems , 2017 , 41 (9 ):58 -64 .
[本文引用: 1]
[11]
XIAO Jun ZHAI Wei GU Wenzhuo Total supply capability and ideal total supply capability for distribution system:Definition,model and algorithm
[C]// CICED 2010 Proceedings , September 13-16,2010 ,Nanjing,China. Piscataway:IEEE, 2010 :1 -7 .
[本文引用: 1]
[12]
吴振威 , 蒋小平 , 马会萌 , 等 . 多时间尺度的光伏出力波动特性研究
[J]. 现代电力 , 2014 , 31 (1 ):58 -61 .
[本文引用: 1]
WU Zhenwei JIANG Xiaoping MA Huimeng et al. Multi-time scale study on photovoltaic output fluctuation characteristics
[J]. Modern Electric Power , 2014 , 31 (1 ):58 -61 .
[本文引用: 1]
[13]
樊磊 . 分布式光伏电源并网出力概率分布模型的研究 [D]. 保定 : 华北电力大学 , 2012 .
[本文引用: 1]
FAN Lei Research on probability distribution model of grid-connected output of distributed photovoltaic power supply [D]. Baoding : North China Electric Power University , 2012 .
[本文引用: 1]
[14]
陈湘如 . 并网光伏电站运行特性分析及发电预测 [D]. 南京 : 东南大学 , 2015 .
[本文引用: 1]
CHEN Xiangru Operation characteristics analysis and generation prediction of grid-connected photovoltaic power station [D]. Nanjing : Southeast University , 2015 .
[本文引用: 1]
[15]
宁阳天 , 李相俊 , 董德华 , 等 . 储能系统平抑风光发电出力波动的研究方法综述
[J]. 供用电 , 2017 , 34 (4 ):2 -11 .
[本文引用: 1]
NING Yangtian LI Xiangjun DONG Dehua et al. A review of research methods of energy storage system to suppress output fluctuation of wind power generation
[J]. Distribution & Utilization , 2017 , 34 (4 ):2 -11 .
[本文引用: 1]
[16]
丁明 , 徐宁舟 , 毕锐 . 用于平抑可再生能源功率波动的储能电站建模及评价
[J]. 电力系统自动化 , 2011 , 35 (2 ):66 -72 .
[本文引用: 1]
DING Ming XU Ningzhou BI Rui Modeling and evaluation of energy storage stations for smoothing power fluctuations of renewable energy sources
[J]. Automation of Electric Power Systems , 2011 , 35 (2 ):66 -72 .
[本文引用: 1]
[17]
陈刚 , 袁越 , 傅质馨 . 储能电池平抑光伏发电波动的应用
[J]. 电力系统及其自动化学报 , 2014 , 26 (2 ):27 -31 ,49.
[本文引用: 1]
CHEN Gang YUAN Yue FU Zhixin Application of energy storage battery to suppress photovoltaic power generation fluctuation
[J]. Proceedings of the CSU-EPSA , 2014 , 26 (2 ):27 -31 ,49.
[本文引用: 1]
[18]
王红艳 , 王依妍 , 陈景文 , 等 . 基于IPMOCSA的光伏微网混合储能容量优化配置
[J]. 电气工程学报 , 2021 , 16 (3 ):152 -160 .
[本文引用: 1]
WANG Hongyan WANG Yiyan CHEN Jingwen et al. Optimal configuration of hybrid energy storage capacity in photovoltaic microgrid based on IPMOCSA
[J]. Journal of Electrical Engineering , 2021 , 16 (3 ):152 -160 .
[本文引用: 1]
[19]
吴盛军 , 徐青山 , 袁晓冬 , 等 . 规模化储能技术在电力系统中的需求与应用分析
[J]. 电气工程学报 , 2017 , 12 (8 ):10 -15 .
[本文引用: 1]
WU Shengjun XU Qingshan YUAN Xiaodong et al. Demand and application analysis of large-scale energy storage technology in power system
[J]. Journal of Electrical Engineering , 2017 , 12 (8 ):10 -15 .
[本文引用: 1]
[20]
BAHRAMIRAD S REDER W KHODAEI A Reliability constrained optimal sizing of energy storage system in a microgrid
[J]. IEEE Transactions on Smart Grid , 2012 , 3 (4 ):2056 -2062 .
DOI:10.1109/TSG.2012.2217991
URL
[本文引用: 1]
中压直流配电网应用场景与系统设计
1
2019
... 随着双碳目标的提出,以及近年来我国正在进行的以绿色低碳发展为要求的新型电力系统中长期规划的推进,包含绿色能源的新型配电系统受到越来越多的关注.直流配电系统在保证对用户安全、可靠、连续供电方面发挥着重要作用.对含有绿色能源的直流配电系统的供电能力进行科学的评估与计算,已成为当前城市电网精细化评估与规划工作的关键一环,对于优化网络结构、指导城市电网的规划和运行,具有巨大的经济效益和社会效益[1 ] .配电网供电能力是指一定供电区域内电网满足N−1条件下最大能满足用户用电的能力,电网供电能力大小取决于换流站站内供电能力和电网供电转移能力[2 ⇓ ⇓ ⇓ -6 ] . ...
Medium voltage DC power distribution network application scenario and system design
1
2019
... 随着双碳目标的提出,以及近年来我国正在进行的以绿色低碳发展为要求的新型电力系统中长期规划的推进,包含绿色能源的新型配电系统受到越来越多的关注.直流配电系统在保证对用户安全、可靠、连续供电方面发挥着重要作用.对含有绿色能源的直流配电系统的供电能力进行科学的评估与计算,已成为当前城市电网精细化评估与规划工作的关键一环,对于优化网络结构、指导城市电网的规划和运行,具有巨大的经济效益和社会效益[1 ] .配电网供电能力是指一定供电区域内电网满足N−1条件下最大能满足用户用电的能力,电网供电能力大小取决于换流站站内供电能力和电网供电转移能力[2 ⇓ ⇓ ⇓ -6 ] . ...
配电网分层供电能力评估与分析
1
2014
... 随着双碳目标的提出,以及近年来我国正在进行的以绿色低碳发展为要求的新型电力系统中长期规划的推进,包含绿色能源的新型配电系统受到越来越多的关注.直流配电系统在保证对用户安全、可靠、连续供电方面发挥着重要作用.对含有绿色能源的直流配电系统的供电能力进行科学的评估与计算,已成为当前城市电网精细化评估与规划工作的关键一环,对于优化网络结构、指导城市电网的规划和运行,具有巨大的经济效益和社会效益[1 ] .配电网供电能力是指一定供电区域内电网满足N−1条件下最大能满足用户用电的能力,电网供电能力大小取决于换流站站内供电能力和电网供电转移能力[2 ⇓ ⇓ ⇓ -6 ] . ...
Evaluation and analysis of hierarchical power supply capability of distribution network
1
2014
... 随着双碳目标的提出,以及近年来我国正在进行的以绿色低碳发展为要求的新型电力系统中长期规划的推进,包含绿色能源的新型配电系统受到越来越多的关注.直流配电系统在保证对用户安全、可靠、连续供电方面发挥着重要作用.对含有绿色能源的直流配电系统的供电能力进行科学的评估与计算,已成为当前城市电网精细化评估与规划工作的关键一环,对于优化网络结构、指导城市电网的规划和运行,具有巨大的经济效益和社会效益[1 ] .配电网供电能力是指一定供电区域内电网满足N−1条件下最大能满足用户用电的能力,电网供电能力大小取决于换流站站内供电能力和电网供电转移能力[2 ⇓ ⇓ ⇓ -6 ] . ...
配电网供电能力研究综述
1
2018
... 随着双碳目标的提出,以及近年来我国正在进行的以绿色低碳发展为要求的新型电力系统中长期规划的推进,包含绿色能源的新型配电系统受到越来越多的关注.直流配电系统在保证对用户安全、可靠、连续供电方面发挥着重要作用.对含有绿色能源的直流配电系统的供电能力进行科学的评估与计算,已成为当前城市电网精细化评估与规划工作的关键一环,对于优化网络结构、指导城市电网的规划和运行,具有巨大的经济效益和社会效益[1 ] .配电网供电能力是指一定供电区域内电网满足N−1条件下最大能满足用户用电的能力,电网供电能力大小取决于换流站站内供电能力和电网供电转移能力[2 ⇓ ⇓ ⇓ -6 ] . ...
Review on power supply capability of distribution network
1
2018
... 随着双碳目标的提出,以及近年来我国正在进行的以绿色低碳发展为要求的新型电力系统中长期规划的推进,包含绿色能源的新型配电系统受到越来越多的关注.直流配电系统在保证对用户安全、可靠、连续供电方面发挥着重要作用.对含有绿色能源的直流配电系统的供电能力进行科学的评估与计算,已成为当前城市电网精细化评估与规划工作的关键一环,对于优化网络结构、指导城市电网的规划和运行,具有巨大的经济效益和社会效益[1 ] .配电网供电能力是指一定供电区域内电网满足N−1条件下最大能满足用户用电的能力,电网供电能力大小取决于换流站站内供电能力和电网供电转移能力[2 ⇓ ⇓ ⇓ -6 ] . ...
配电网供电能力的实时评估分析
1
2009
... 随着双碳目标的提出,以及近年来我国正在进行的以绿色低碳发展为要求的新型电力系统中长期规划的推进,包含绿色能源的新型配电系统受到越来越多的关注.直流配电系统在保证对用户安全、可靠、连续供电方面发挥着重要作用.对含有绿色能源的直流配电系统的供电能力进行科学的评估与计算,已成为当前城市电网精细化评估与规划工作的关键一环,对于优化网络结构、指导城市电网的规划和运行,具有巨大的经济效益和社会效益[1 ] .配电网供电能力是指一定供电区域内电网满足N−1条件下最大能满足用户用电的能力,电网供电能力大小取决于换流站站内供电能力和电网供电转移能力[2 ⇓ ⇓ ⇓ -6 ] . ...
Real-time evaluation and analysis of power supply capacity of distribution network
1
2009
... 随着双碳目标的提出,以及近年来我国正在进行的以绿色低碳发展为要求的新型电力系统中长期规划的推进,包含绿色能源的新型配电系统受到越来越多的关注.直流配电系统在保证对用户安全、可靠、连续供电方面发挥着重要作用.对含有绿色能源的直流配电系统的供电能力进行科学的评估与计算,已成为当前城市电网精细化评估与规划工作的关键一环,对于优化网络结构、指导城市电网的规划和运行,具有巨大的经济效益和社会效益[1 ] .配电网供电能力是指一定供电区域内电网满足N−1条件下最大能满足用户用电的能力,电网供电能力大小取决于换流站站内供电能力和电网供电转移能力[2 ⇓ ⇓ ⇓ -6 ] . ...
配电系统供电能力模型
1
2011
... 随着双碳目标的提出,以及近年来我国正在进行的以绿色低碳发展为要求的新型电力系统中长期规划的推进,包含绿色能源的新型配电系统受到越来越多的关注.直流配电系统在保证对用户安全、可靠、连续供电方面发挥着重要作用.对含有绿色能源的直流配电系统的供电能力进行科学的评估与计算,已成为当前城市电网精细化评估与规划工作的关键一环,对于优化网络结构、指导城市电网的规划和运行,具有巨大的经济效益和社会效益[1 ] .配电网供电能力是指一定供电区域内电网满足N−1条件下最大能满足用户用电的能力,电网供电能力大小取决于换流站站内供电能力和电网供电转移能力[2 ⇓ ⇓ ⇓ -6 ] . ...
Power supply capability model of distribution system
1
2011
... 随着双碳目标的提出,以及近年来我国正在进行的以绿色低碳发展为要求的新型电力系统中长期规划的推进,包含绿色能源的新型配电系统受到越来越多的关注.直流配电系统在保证对用户安全、可靠、连续供电方面发挥着重要作用.对含有绿色能源的直流配电系统的供电能力进行科学的评估与计算,已成为当前城市电网精细化评估与规划工作的关键一环,对于优化网络结构、指导城市电网的规划和运行,具有巨大的经济效益和社会效益[1 ] .配电网供电能力是指一定供电区域内电网满足N−1条件下最大能满足用户用电的能力,电网供电能力大小取决于换流站站内供电能力和电网供电转移能力[2 ⇓ ⇓ ⇓ -6 ] . ...
基于最大供电能力的配电网规划理念与方法
1
2013
... 随着双碳目标的提出,以及近年来我国正在进行的以绿色低碳发展为要求的新型电力系统中长期规划的推进,包含绿色能源的新型配电系统受到越来越多的关注.直流配电系统在保证对用户安全、可靠、连续供电方面发挥着重要作用.对含有绿色能源的直流配电系统的供电能力进行科学的评估与计算,已成为当前城市电网精细化评估与规划工作的关键一环,对于优化网络结构、指导城市电网的规划和运行,具有巨大的经济效益和社会效益[1 ] .配电网供电能力是指一定供电区域内电网满足N−1条件下最大能满足用户用电的能力,电网供电能力大小取决于换流站站内供电能力和电网供电转移能力[2 ⇓ ⇓ ⇓ -6 ] . ...
Distribution network planning concept and method based on maximum power supply capacity
1
2013
... 随着双碳目标的提出,以及近年来我国正在进行的以绿色低碳发展为要求的新型电力系统中长期规划的推进,包含绿色能源的新型配电系统受到越来越多的关注.直流配电系统在保证对用户安全、可靠、连续供电方面发挥着重要作用.对含有绿色能源的直流配电系统的供电能力进行科学的评估与计算,已成为当前城市电网精细化评估与规划工作的关键一环,对于优化网络结构、指导城市电网的规划和运行,具有巨大的经济效益和社会效益[1 ] .配电网供电能力是指一定供电区域内电网满足N−1条件下最大能满足用户用电的能力,电网供电能力大小取决于换流站站内供电能力和电网供电转移能力[2 ⇓ ⇓ ⇓ -6 ] . ...
基于主换流器互联关系的配电系统供电能力计算方法
1
2009
... 文献[7 ]提出了电网在满足N−1安全准则条件下进行负荷转移时的供电恢复能力指标,该方法侧重于评估电网不同运行方式的供电恢复能力,没有直接计算电网的最大供电能力;文献[8 ]提出了配电网安全分析的k(N-1+1)安全准则以及基于k(N-1+1)安全准则的故障后供电恢复的重构算法;文献[9 ]提出能够计算N-1安全准则条件下的配电网站内、网络转移供电能力的实用方法,但该方法未严格建立模型.文献[10 ]利用蒙特卡洛抽样法建立了分布式电源输出功率的概率模型,在此基础上分析了辐射型、环形、网状结构对直流配电网供电能力的影响.文献[11 ]提出了系统最大供电能力和系统潜在最大供电能力两个指标的定义、模型和算法,但是并未考虑新型直流配电网中绿色能源的接入对供电能力的影响. ...
Power supply capacity calculation method of distribution system based on main transformer interconnection
1
2009
... 文献[7 ]提出了电网在满足N−1安全准则条件下进行负荷转移时的供电恢复能力指标,该方法侧重于评估电网不同运行方式的供电恢复能力,没有直接计算电网的最大供电能力;文献[8 ]提出了配电网安全分析的k(N-1+1)安全准则以及基于k(N-1+1)安全准则的故障后供电恢复的重构算法;文献[9 ]提出能够计算N-1安全准则条件下的配电网站内、网络转移供电能力的实用方法,但该方法未严格建立模型.文献[10 ]利用蒙特卡洛抽样法建立了分布式电源输出功率的概率模型,在此基础上分析了辐射型、环形、网状结构对直流配电网供电能力的影响.文献[11 ]提出了系统最大供电能力和系统潜在最大供电能力两个指标的定义、模型和算法,但是并未考虑新型直流配电网中绿色能源的接入对供电能力的影响. ...
配电网安全分析的k(n-1+1)准则
1
2001
... 文献[7 ]提出了电网在满足N−1安全准则条件下进行负荷转移时的供电恢复能力指标,该方法侧重于评估电网不同运行方式的供电恢复能力,没有直接计算电网的最大供电能力;文献[8 ]提出了配电网安全分析的k(N-1+1)安全准则以及基于k(N-1+1)安全准则的故障后供电恢复的重构算法;文献[9 ]提出能够计算N-1安全准则条件下的配电网站内、网络转移供电能力的实用方法,但该方法未严格建立模型.文献[10 ]利用蒙特卡洛抽样法建立了分布式电源输出功率的概率模型,在此基础上分析了辐射型、环形、网状结构对直流配电网供电能力的影响.文献[11 ]提出了系统最大供电能力和系统潜在最大供电能力两个指标的定义、模型和算法,但是并未考虑新型直流配电网中绿色能源的接入对供电能力的影响. ...
k(n-1+1) criterion for distribution network security analysis
1
2001
... 文献[7 ]提出了电网在满足N−1安全准则条件下进行负荷转移时的供电恢复能力指标,该方法侧重于评估电网不同运行方式的供电恢复能力,没有直接计算电网的最大供电能力;文献[8 ]提出了配电网安全分析的k(N-1+1)安全准则以及基于k(N-1+1)安全准则的故障后供电恢复的重构算法;文献[9 ]提出能够计算N-1安全准则条件下的配电网站内、网络转移供电能力的实用方法,但该方法未严格建立模型.文献[10 ]利用蒙特卡洛抽样法建立了分布式电源输出功率的概率模型,在此基础上分析了辐射型、环形、网状结构对直流配电网供电能力的影响.文献[11 ]提出了系统最大供电能力和系统潜在最大供电能力两个指标的定义、模型和算法,但是并未考虑新型直流配电网中绿色能源的接入对供电能力的影响. ...
Rapid evaluation method for power supply capability of urban distribution system based on N-1 contingency analysis of main-transformers
1
2010
... 文献[7 ]提出了电网在满足N−1安全准则条件下进行负荷转移时的供电恢复能力指标,该方法侧重于评估电网不同运行方式的供电恢复能力,没有直接计算电网的最大供电能力;文献[8 ]提出了配电网安全分析的k(N-1+1)安全准则以及基于k(N-1+1)安全准则的故障后供电恢复的重构算法;文献[9 ]提出能够计算N-1安全准则条件下的配电网站内、网络转移供电能力的实用方法,但该方法未严格建立模型.文献[10 ]利用蒙特卡洛抽样法建立了分布式电源输出功率的概率模型,在此基础上分析了辐射型、环形、网状结构对直流配电网供电能力的影响.文献[11 ]提出了系统最大供电能力和系统潜在最大供电能力两个指标的定义、模型和算法,但是并未考虑新型直流配电网中绿色能源的接入对供电能力的影响. ...
含分布式电源的直流配电网供电能力评估
1
2017
... 文献[7 ]提出了电网在满足N−1安全准则条件下进行负荷转移时的供电恢复能力指标,该方法侧重于评估电网不同运行方式的供电恢复能力,没有直接计算电网的最大供电能力;文献[8 ]提出了配电网安全分析的k(N-1+1)安全准则以及基于k(N-1+1)安全准则的故障后供电恢复的重构算法;文献[9 ]提出能够计算N-1安全准则条件下的配电网站内、网络转移供电能力的实用方法,但该方法未严格建立模型.文献[10 ]利用蒙特卡洛抽样法建立了分布式电源输出功率的概率模型,在此基础上分析了辐射型、环形、网状结构对直流配电网供电能力的影响.文献[11 ]提出了系统最大供电能力和系统潜在最大供电能力两个指标的定义、模型和算法,但是并未考虑新型直流配电网中绿色能源的接入对供电能力的影响. ...
Power supply capability evaluation of DC distribution network with distributed power supply
1
2017
... 文献[7 ]提出了电网在满足N−1安全准则条件下进行负荷转移时的供电恢复能力指标,该方法侧重于评估电网不同运行方式的供电恢复能力,没有直接计算电网的最大供电能力;文献[8 ]提出了配电网安全分析的k(N-1+1)安全准则以及基于k(N-1+1)安全准则的故障后供电恢复的重构算法;文献[9 ]提出能够计算N-1安全准则条件下的配电网站内、网络转移供电能力的实用方法,但该方法未严格建立模型.文献[10 ]利用蒙特卡洛抽样法建立了分布式电源输出功率的概率模型,在此基础上分析了辐射型、环形、网状结构对直流配电网供电能力的影响.文献[11 ]提出了系统最大供电能力和系统潜在最大供电能力两个指标的定义、模型和算法,但是并未考虑新型直流配电网中绿色能源的接入对供电能力的影响. ...
Total supply capability and ideal total supply capability for distribution system:Definition,model and algorithm
1
2010
... 文献[7 ]提出了电网在满足N−1安全准则条件下进行负荷转移时的供电恢复能力指标,该方法侧重于评估电网不同运行方式的供电恢复能力,没有直接计算电网的最大供电能力;文献[8 ]提出了配电网安全分析的k(N-1+1)安全准则以及基于k(N-1+1)安全准则的故障后供电恢复的重构算法;文献[9 ]提出能够计算N-1安全准则条件下的配电网站内、网络转移供电能力的实用方法,但该方法未严格建立模型.文献[10 ]利用蒙特卡洛抽样法建立了分布式电源输出功率的概率模型,在此基础上分析了辐射型、环形、网状结构对直流配电网供电能力的影响.文献[11 ]提出了系统最大供电能力和系统潜在最大供电能力两个指标的定义、模型和算法,但是并未考虑新型直流配电网中绿色能源的接入对供电能力的影响. ...
多时间尺度的光伏出力波动特性研究
1
2014
... 直流配电网发展的驱动力之一为更加高效地实现新能源接入.相比于传统换流站,新能源电站的出力受到环境条件的影响,具有随机性[12 ] . ...
Multi-time scale study on photovoltaic output fluctuation characteristics
1
2014
... 直流配电网发展的驱动力之一为更加高效地实现新能源接入.相比于传统换流站,新能源电站的出力受到环境条件的影响,具有随机性[12 ] . ...
1
2012
... 在特定时间段内太阳光照强度近似服从Beta分布[13 -14 ] ,结合光伏出力与光照强度的关系,可得光伏出力的概率函数为 ...
1
2012
... 在特定时间段内太阳光照强度近似服从Beta分布[13 -14 ] ,结合光伏出力与光照强度的关系,可得光伏出力的概率函数为 ...
1
2015
... 在特定时间段内太阳光照强度近似服从Beta分布[13 -14 ] ,结合光伏出力与光照强度的关系,可得光伏出力的概率函数为 ...
1
2015
... 在特定时间段内太阳光照强度近似服从Beta分布[13 -14 ] ,结合光伏出力与光照强度的关系,可得光伏出力的概率函数为 ...
储能系统平抑风光发电出力波动的研究方法综述
1
2017
... 直流配电网中储能的加入可以起到平抑光伏发电出力波动性的作用[15 ⇓ ⇓ ⇓ -19 ] ,如图5 所示. ...
A review of research methods of energy storage system to suppress output fluctuation of wind power generation
1
2017
... 直流配电网中储能的加入可以起到平抑光伏发电出力波动性的作用[15 ⇓ ⇓ ⇓ -19 ] ,如图5 所示. ...
用于平抑可再生能源功率波动的储能电站建模及评价
1
2011
... 直流配电网中储能的加入可以起到平抑光伏发电出力波动性的作用[15 ⇓ ⇓ ⇓ -19 ] ,如图5 所示. ...
Modeling and evaluation of energy storage stations for smoothing power fluctuations of renewable energy sources
1
2011
... 直流配电网中储能的加入可以起到平抑光伏发电出力波动性的作用[15 ⇓ ⇓ ⇓ -19 ] ,如图5 所示. ...
储能电池平抑光伏发电波动的应用
1
2014
... 直流配电网中储能的加入可以起到平抑光伏发电出力波动性的作用[15 ⇓ ⇓ ⇓ -19 ] ,如图5 所示. ...
Application of energy storage battery to suppress photovoltaic power generation fluctuation
1
2014
... 直流配电网中储能的加入可以起到平抑光伏发电出力波动性的作用[15 ⇓ ⇓ ⇓ -19 ] ,如图5 所示. ...
基于IPMOCSA的光伏微网混合储能容量优化配置
1
2021
... 直流配电网中储能的加入可以起到平抑光伏发电出力波动性的作用[15 ⇓ ⇓ ⇓ -19 ] ,如图5 所示. ...
Optimal configuration of hybrid energy storage capacity in photovoltaic microgrid based on IPMOCSA
1
2021
... 直流配电网中储能的加入可以起到平抑光伏发电出力波动性的作用[15 ⇓ ⇓ ⇓ -19 ] ,如图5 所示. ...
规模化储能技术在电力系统中的需求与应用分析
1
2017
... 直流配电网中储能的加入可以起到平抑光伏发电出力波动性的作用[15 ⇓ ⇓ ⇓ -19 ] ,如图5 所示. ...
Demand and application analysis of large-scale energy storage technology in power system
1
2017
... 直流配电网中储能的加入可以起到平抑光伏发电出力波动性的作用[15 ⇓ ⇓ ⇓ -19 ] ,如图5 所示. ...
Reliability constrained optimal sizing of energy storage system in a microgrid
1
2012
... 本文研究的直流配电网共配置3个光储电站,因此在3个光储电站中储能容量如何分配,以求得对直流配电网供电能力提升作用最大值得研究[20 ] . ...


