


1 引言
牵引变流器是电力机车和电动车组电能变换的关键设备。目前全世界仍有大量交直传动机车服役,仅中国就达数千辆,这些机车运行年限较长,牵引变流器出现几率较大,当牵引系统出现故障时,会引起轨道车辆性能或功能受损,甚至直接导致机破,使铁路运输中断,造成巨大的经济损失和社会危害,而原有的检测方法诊断功能单一,因此对其牵引变流器安全服役及保障技术的研究具有重大的意义。
现有的变流器故障诊断方法的研究主要可归类为以下两种:一种侧重于软件算法,通过对采样电流/电压进行复杂的运算获得故障特征,例如频谱分析、小波分析等;另一种着重于硬件实现,主要是通过添加一些电流/电压/热传感器和检测电路在变流器不同的位置上来获得故障检测的详细信息。
本文以交直传动中最为常见的三段不等分半控桥整流器作为研究对象,通过深入分析其正常与故障工作状态下的输入电流特性,提出一种新型的故障诊断及定位方法。利用两个输入电流差估计值与测量值之间的误差作为参考变量进行判断,并使用环形霍尔传感器来测量电流,将对系统的改动最小化。该方法具有对原系统影响小、成本低、不受负载影响且诊断快速等优点,诊断时间只需要两个基本周期。
2 系统描述
2.1 系统架构
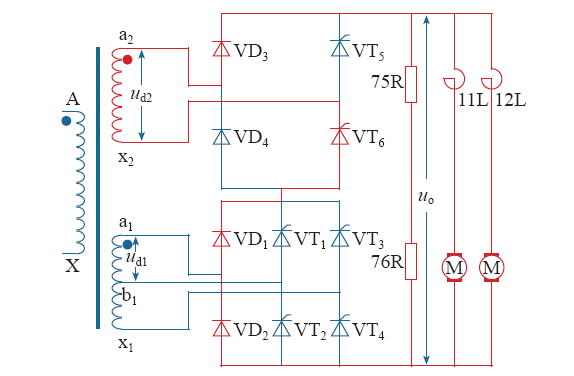
图1所示为三段不等分半控桥整流系统拓扑图。图中VD1~VD4为二极管,VT1~VT6为晶闸管,a1b1x1和a2x2为牵引变压器牵引绕组,系统输入电压为ud,b1x1和a1b1上的电压分别为ud0和ud1,且ud0 = ud1 = 1/4ud,a2x2上的电压为ud2 = 1/2ud,输出电压为uo,输出电流为io,75R/76R是空载电阻,也可用于吸收过电压,11L和12L为牵引电机的平波电抗器。其中,i1、i2分别为从a2、a1流出的电流,i3为流入x1的电流,i4为流经VD3的电流。
图1
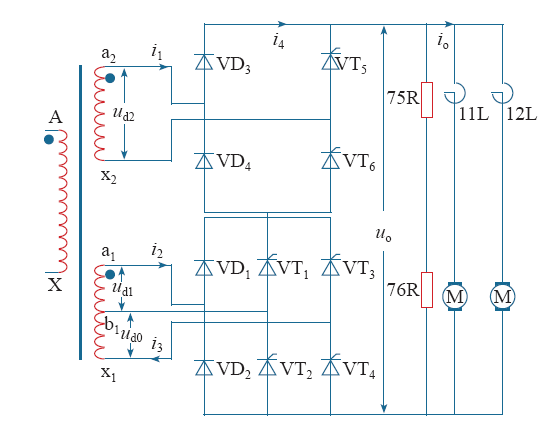
此整流电路为不等分三段桥顺序控制的相控无级调压方式。控制逻辑按先开大桥(a2 - x2),再开小桥(a1 - b1)加小桥(b1 - x1)的顺序控制关系来实现。
2.2 系统工作状态分析
图2为系统正常工作时的波形。根据投入变压器绕组数量的不同,可以分为三个阶段。
图2
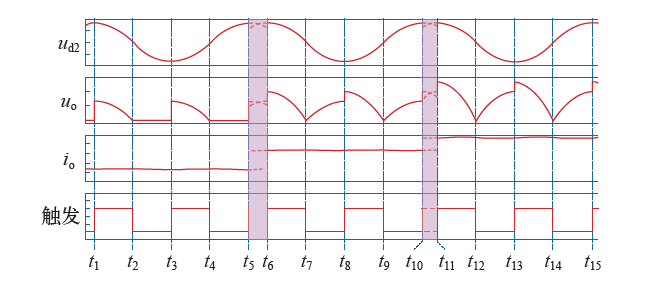
第一阶段(t1~t5):变流器与a2x2绕组相连的部分开始工作,控制VT5和VT6的移相角,从而实现变流器输出电压在0~1/2Uo之间连续可变(Uo为ud(t)在一个周期内的全波整流有效值)。
第二阶段(t6~t10):输出电压增大到1/2Uo时(t6),与a1b1绕组相连的部分开始工作,此阶段VT5和VT6维持满开放,通过控制VT1和VT2实现输出电压在1/2Uo~3/4Uo间变化。
第三阶段(t11~t15):当系统负载增大到输出电压达到3/4Uo时(t11),绕组b1x1投入,此阶段VT5、VT6、VT1和VT2维持满开放,控制VT3和VT4实现输出电压在3/4Uo~Uo间变化。
根据检测到的输入电压ud值定义一个周期内tk~tk+4五个时刻如下
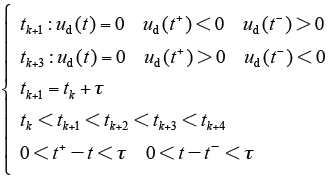
由于输入电压为工频50Hz,τ的值为恒定值0.005s。按式(1)的约束条件将一个工作周期分为tk+~t-k+1、t+k+1~t-k+2、t+k+2~t-k+3、t+k+3~t-k+4四个时期。
如上所述,系统工作的三个阶段的每个工作周期均可分为四个时期。
第一阶段:
(1)T1时期(t1+~t2-):在t1时刻,输入电压处于正弦波的正半周,导通VT6,电流流向为a2→VD3→ VD2 →VD1→VT6→x2。
(2)T2时期(t2+~t3-):t2时刻输入电压自然过零,VT6承受反向电压自然关断,电流通过VD1~ VD4续流,电流流向为VD3→VD2→VD1→VD4。
(3)T3时期(t3+~t4-):t3时刻需根据负载选定,此刻输入电压在负半周,VT5触发导通,电流流向为x2→VT5→VD2→VD1→VD4→a2。
(4)T4时期(t4+~t5-):t4时刻,输入电压自然过零,VT5自然关断,电流通过VD1~VD4续流,电流流向与T1时期相同。
第二阶段:
(1)T1时期(t6+~t7-):输入电压处于正半周,在t6时刻导通VT2,电流流向为a2→VD3→VT2→ b1→a1→VD1→VT6→x2。
(2)T2时期(t7+~t8-):t7时刻输入电压自然过零,VT2承受反向电压自然关断,a1b1绕组不参与供电,系统仅由a2x2绕组供电,VD1和VD2续流,电流流向应为x2→VT5→VD2→VD1→VD4→a2。
(3)T3时期(t8+~t9-):t8时刻VT1导通,a1b1和a2x2向系统供电,电流流向为a2→VT5→VD2→ a1→b1→VT3→VD4→a2。
(4)T4时期(t9+~t-10):t9时刻输入电压自然过零,VT1承受反向电压自然关断,电流流向为a2→VD3→VD2→VD1→VT6→x2。
第三阶段:
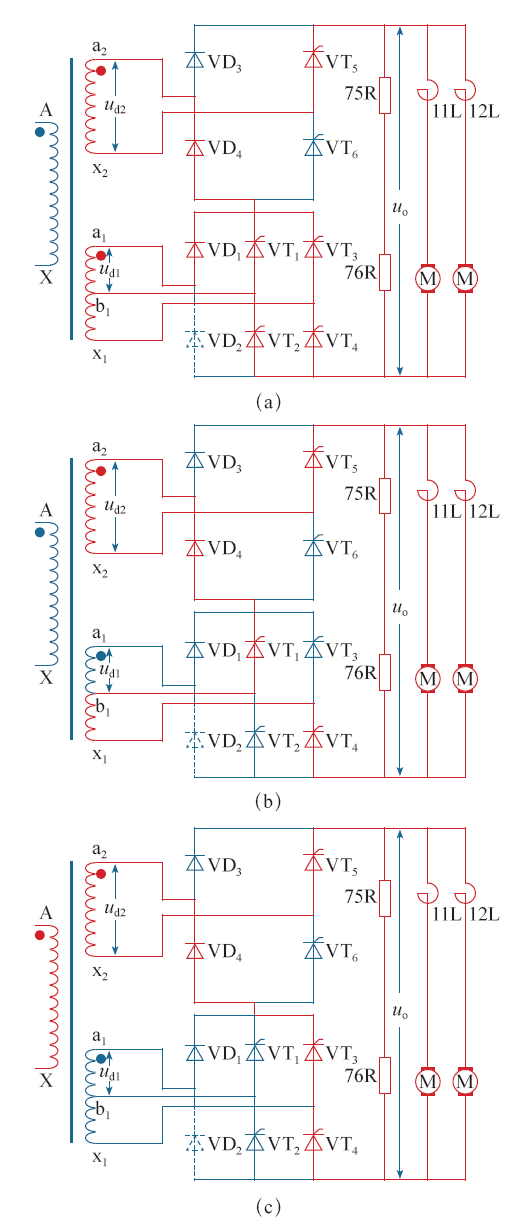
(1)T1时期(t11+~t12-):t11时刻投入绕组b1x1,若 ud(t)处于正半周,导通VT4,电流流向应为a2→ VD3→VT4→x1→a1→VD1→VT6→x2,如图3a所示。
图3
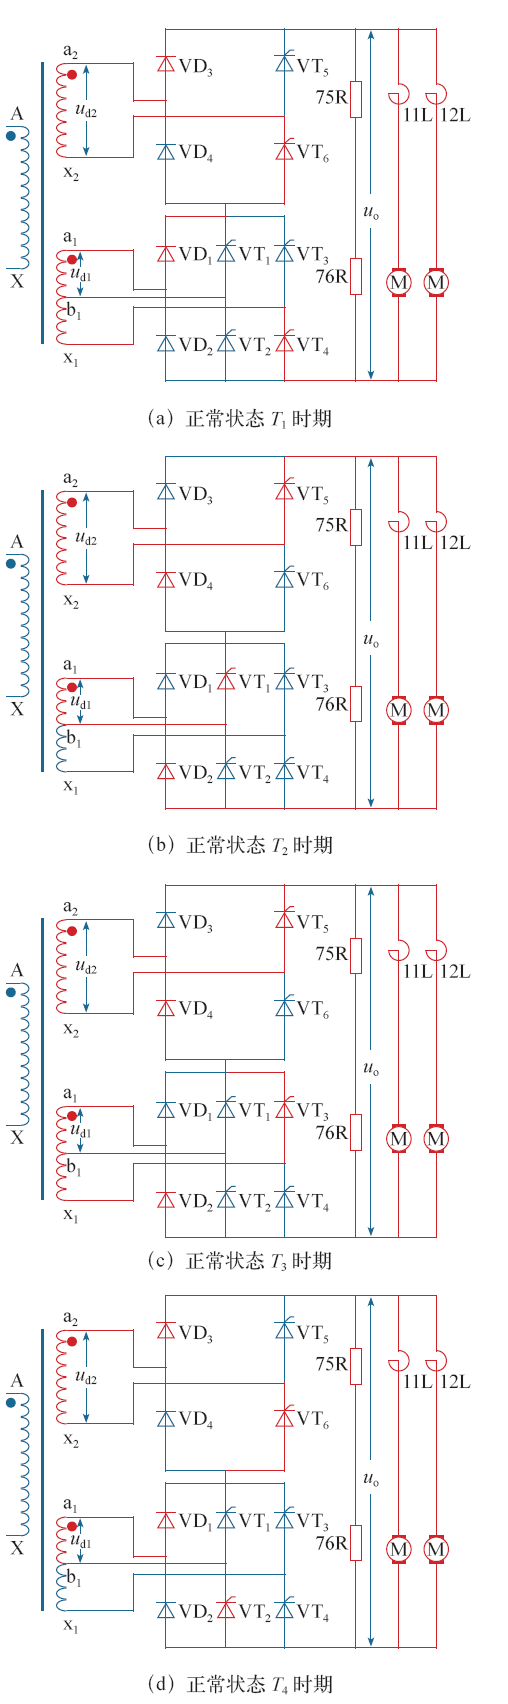
(2)T2时期(t12+~t13-):t12时刻ud(t)过零,VT4自然关断,VT1、VD2、VT5和VD4参与变流,电流流向应为x2→VT5→VD2→a1→b1→VT1→VD4→ a2,如图3b所示。
(3)T3时期(t13+~t14-):t13时刻导通VT3,电流从VT1自然换流至VT3,电流流向应为x2→VT5→ VD2→a1→x1→VT3→VD4→a2,如图3c所示。
(4)T4时期(t14+~t15-):t14时刻VT3承受反压关断,VT2、VD1、VT6和VD3满开放,电流流向应为a2→ VD3→VT2→b1→a1→VD1→VT6→x2,如图3d所示。直至t15再次触发VT4,系统进入下一工作周期。
因开路故障多发生在负载较大时,所以本文主要研究系统已稳定工作于所有开关管全部投入使用的情况,即第三个阶段。
3 开路故障表现和状态分析
为了保证分析有效性,做如下假设:①所有器件都是理想的,且系统已工作在稳态。②牵引电机可以被视为电阻、电感和反电势组合的负载。
当变流器发生开路或短路故障时,由于设计有熔断器,短路故障在极短的时间内转变为开路故障。因此,本系统主要考虑单管开路故障。本节针对二极管和晶闸管开路时系统的工作状态分别进行分析,以VT4和VD2为例。
3.1 VT4开路故障
图4
3.2 VD2开路故障
图5
按以上的方法分别对其他管开路故障情况进行分析,并将其故障发生一个周期后的电流流向汇总成表1,其中“~”表示与正常状态电流流向相同。
表1 不同状态下的电流流向表
Tab.1
| 故障管周期 | T1 |
|---|---|
| 正常 | a2→VD3→VT4→x1→a1→VD1→VT6→x2 |
| VT1 | ~ |
| VT2 | ~ |
| VT3 | ~ |
| VT4 | a2→VD3→VT2→b1→a1→VD1→VT6→x2 |
| VT5 | ~ |
| VT6 | VD3→VT4→x1→a1→VD1→VD4 |
| VD3 | VT5→VT4→x1→a1→VD1→VT6 |
| VD4 | ~ |
| VD1 | a2→VD3→VT4→VT3→VT6→x2 |
| VD2 | ~ |
| 故障管周期 | T2 |
| 正常 | x2→VT5→VD2→a1→b1→VT1→VD4→a2 |
| VT1 | x2→VT5→VD2→VD1→VD4→a2 |
| VT2 | ~ |
| VT3 | ~ |
| VT4 | ~ |
| VT5 | VD3→VD2→a1→b1→VT1→VD4 |
| VT6 | ~ |
| VD3 | ~ |
| VD4 | VT5→VD2→a1→b1→VT1→VT6 |
| VD1 | x2→VT5→VD2→a1→x1→VT3→VD4→a2 |
| VD2 | x2→VT5→VT4→VT1→VD4→a2 |
| 故障管周期 | T3 |
| 正常 | x2→VT5→VD2→a1→x1→VT3→VD4→a2 |
| VT1 | ~ |
| VT2 | ~ |
| VT3 | x2→VT5→VD2→a1→b1→VT1→VD4→a2 |
| VT4 | ~ |
| VT5 | VD3→VD2→a1→x1→VT3→VD4 |
| VT6 | ~ |
| VD3 | ~ |
| VD4 | VT5→VD2→a1→x1→VT3→VT6 |
| VD1 | ~ |
| VD2 | x2→VT5→VT4→VT3→VD4→a2 |
| 故障管周期 | T4 |
| 正常 | a2→VD3→VT2→b1→a1→VD1→VT6→x2 |
| VT1 | ~ |
| VT2 | a2→VD3→VD2→VD1→VT6→x2 |
| VT3 | ~ |
| (续) | |
| 故障管周期 | T4 |
| VT4 | ~ |
| VT5 | ~ |
| VT6 | VD3→VT2→b1→a1→VD1→VD4 |
| VD3 | VT5→VT2→b1→a1→VD1→VT6 |
| VD4 | ~ |
| VD1 | a2→VD3→VT2→VT3→VT6→x2 |
| VD2 | a2→VD3→VT4→x1→a1→VD1→VT6→x2 |
根据表1的数据可以看出,任意开关管开路故障都会使得输入电流某一段开路,可由此进行故障检测。
4 开路故障诊断和定位方法
4.1 开路故障诊断及定位方法设计
为保证故障诊断及定位方法的实用性,尽量在系统已有的信号中选取用于诊断和控制的信号,最小化系统的改动。开关管发生开路故障在输入电流上存在区别,为区分各个开关管的故障,选取变流器输入电流i1、i2作为诊断参考量。基于以上的故障分析,将正常和故障状态下的两个输入电流的极性统计成表2,其中“+”号表示电流为正,“-”表示电流为负,“0”表示电流为零。
表2 故障诊断表
Tab.2
| 故障管周期 | i1 | i2 | ||||||
|---|---|---|---|---|---|---|---|---|
| 电流 | T1 | T2 | T3 | T4 | T1 | T2 | T3 | T4 |
| 正常 | + | - | - | + | + | - | - | + |
| VT4 | + | - | - | + | + | - | - | + |
| VT3 | + | - | - | + | + | - | - | + |
| VT1 | + | - | - | + | + | 0 | - | + |
| VT2 | + | - | - | + | + | - | - | 0 |
| VD2 | + | - | - | + | + | + | 0 | + |
| VD1 | + | - | - | + | 0 | - | - | - |
| VT6 | 0 | - | - | 0 | + | - | - | + |
| VT5 | + | 0 | 0 | + | + | - | - | + |
| VD4 | + | 0 | 0 | + | + | - | - | + |
| VD3 | 0 | - | 0 | + | - | - | + | |
分析系统的工作原理,结合上表所示数据可知,在正常状态下i1和i2的大小和方向都是相同的,而故障状态下会产生差异。为了更直观地表示故障特征,设计将i1减去i2,得到电流差

在忽略线路损耗和干扰的情况下,正常状态同一时刻i1与i2的大小相等方向相同,定义电流差误差阈值Ti,正常状态下δi的值应处于[-Ti,+Ti]范围内,通过实验数据将Ti的值设置为50A,定义电流差δ为
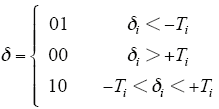
根据式(3)可以得到在不同的故障条件下的δ值及其编码表,见表3。
表3 δ值编码表
Tab.3
| 故障管周期 | δ | 编 码 | |||
|---|---|---|---|---|---|
| 变量 | T1 | T2 | T3 | T4 | |
| 正常 | 00 | 00 | 00 | 00 | 00000000 |
| VT4 | 00 | 00 | 00 | 00 | 00000000 |
| VT3 | 00 | 00 | 00 | 00 | 00000000 |
| VT1 | 00 | 01 | 00 | 00 | 00010000 |
| VT2 | 00 | 00 | 00 | 10 | 00000010 |
| VD2 | 00 | 01 | 01 | 00 | 00010100 |
| VD1 | 10 | 00 | 00 | 10 | 10000010 |
| VT6 | 01 | 00 | 00 | 01 | 01000001 |
| VT5 | 00 | 10 | 10 | 00 | 00101000 |
| VD4 | 00 | 10 | 10 | 00 | 00101000 |
| VD3 | 01 | 00 | 00 | 01 | 01000001 |
由表3可以看出,通过δ值能够检测出除了VT4和VT3之外的所有管的故障,其中VT5和VD4以及VT6和VD3故障特征相同,无法精确定位,下一节将对此提出改进设计方法。
4.2 针对VT4和VT3、VT5和VD4以及VT6和VD3的故障诊断改进方法
将表1中VT4和VT3的流向与正常情况下的进行比较,可以看出,在故障周期内投入运行的桥从a1 - x1变成了a1 - b1,故其故障状态可以用流入x1的电流即i3来表征。
同样通过表1可以发现,VT6和VD3故障时电流流向变化都表现在T1和T4时期,VT6故障时电流通过VD4和VD3续流,而VD3故障时电流流经VT6和VT5,VT5和VD4的故障表现与之类似。结合三段不等分半控桥整流系统拓扑图分析,其故障状态可以用流经VD3的电流即i4来进行精确定位。
通过上述分析可知,VT4和VT3故障表现在于电流i3的有无,VT5和VD4以及VT6和VD3的故障区别在于电流i4的有无,根据不同故障条件下的状态列出故障诊断补充表,见表4。其中,“+”号表示电流为正,“-”表示电流为负,“0”表示电流为零。
表4 故障诊断补充表
Tab.4
| 故障管周期 | i3 | i4 | ||||||
|---|---|---|---|---|---|---|---|---|
| 电流 | T1 | T2 | T3 | T4 | T1 | T2 | T3 | T4 |
| 正常 | + | 0 | - | 0 | + | 0 | 0 | + |
| VT4 | 0 | 0 | - | 0 | + | 0 | 0 | + |
| VT3 | + | 0 | 0 | 0 | + | 0 | 0 | + |
| VT1 | + | 0 | - | 0 | + | 0 | 0 | + |
| VT2 | + | 0 | - | 0 | + | 0 | 0 | + |
| VD2 | + | + | 0 | 0 | + | 0 | 0 | + |
| VD1 | 0 | 0 | - | + | + | 0 | 0 | + |
| VT6 | + | 0 | - | 0 | + | 0 | 0 | + |
| VT5 | + | 0 | - | 0 | + | + | + | + |
| VD4 | + | 0 | - | 0 | + | 0 | 0 | + |
| VD3 | + | 0 | - | 0 | 0 | 0 | 0 | 0 |
为了更清楚地表示故障特征,设计将i3减去i4,得到另一个电流差

通过δi′的变化来诊断开路故障。同样地,定义电流差码δ′为
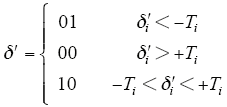
表5 δ′编码表
Tab.5
| 故障管周期 | δ′ | 编码 | |||
|---|---|---|---|---|---|
| 变量 | T1 | T2 | T3 | T4 | |
| 正常 | 00 | 00 | 01 | 01 | 00000101 |
| VT4 | 01 | 00 | 01 | 01 | 01000101 |
| VT3 | 00 | 00 | 00 | 01 | 00000001 |
| VT1 | 00 | 00 | 01 | 01 | 00000101 |
| VT2 | 00 | 00 | 01 | 01 | 00000101 |
| VD2 | 00 | 10 | 00 | 01 | 00100001 |
| VD1 | 01 | 00 | 01 | 00 | 01000100 |
| VT6 | 00 | 00 | 01 | 01 | 00000101 |
| VT5 | 00 | 01 | 01 | 01 | 00010101 |
| VD4 | 00 | 00 | 01 | 01 | 00000101 |
| VD3 | 10 | 00 | 01 | 00 | 10000100 |
由表5可以看出,通过δ′能够检测出VT4和VT3的故障,并能区分VT5和VD4以及VT6和VD3故障特征,得到精确定位。
4.3 系统轻载时的故障诊断与定位
当系统处于第一阶段时,由于a1x1绕组并未投入使用,检测电流i2与i3是无效的,故诊断变量δi = i1,δi′ = -i4,为方便起见,将变量设为δi 和-δi′,通过分析得到第二阶段的故障诊断编码见表6,其分析过程与第三阶段类似,这里不再赘述。
表6 第一阶段故障编码表
Tab.6
| 故障管周期 | δ | -δ′ | ||||||
|---|---|---|---|---|---|---|---|---|
| 变量 | T1 | T2 | T3 | T4 | T1 | T2 | T3 | T4 |
| 正常 | 10 | 00 | 01 | 00 | 10 | 10 | 00 | 10 |
| VD2 | 00 | 00 | 00 | 00 | 00 | 00 | 00 | 00 |
| VD1 | 00 | 00 | 00 | 00 | 00 | 00 | 00 | 00 |
| VT6 | 00 | 00 | 01 | 00 | 10 | 10 | 00 | 10 |
| VT5 | 10 | 00 | 00 | 00 | 10 | 10 | 10 | 10 |
| VD4 | 10 | 00 | 00 | 00 | 10 | 00 | 00 | 00 |
| VD3 | 00 | 00 | 01 | 00 | 00 | 00 | 00 | 00 |
VT1~VT4未参与第一阶段的变流,故未在表中示出,从表6可以看出,根据两个故障诊断变量可以检测出参与变流的所有开关管的故障,并且能够定位除了VD1和VD2之外的所有开关管的故障。由于系统工作状态限定,VD1和VD2无法进行精确定位。
当系统处于第二阶段时,由于b1x1绕组未投入使用,VT3和VT4未参与变流,i3是无效值,故诊断变量δi = i1 - i2,δi′ = -i4,同样将变量设为δi和-δi′,通过与上述类似分析得到第二阶段的故障诊断编码见表7。
表7 第二阶段故障编码表
Tab.7
| 故障管周期 | δ | -δ′ | ||||||
|---|---|---|---|---|---|---|---|---|
| 变量 | T1 | T2 | T3 | T4 | T1 | T2 | T3 | T4 |
| 正常 | 00 | 01 | 00 | 10 | 10 | 00 | 00 | 10 |
| VT1 | 00 | 01 | 01 | 10 | 10 | 00 | 00 | 10 |
| VT2 | 10 | 01 | 10 | 10 | 10 | 00 | 00 | 10 |
| VD2 | 00 | 01 | 01 | 10 | 10 | 00 | 00 | 10 |
| VD1 | 10 | 01 | 10 | 10 | 10 | 00 | 00 | 10 |
| VT6 | 01 | 01 | 00 | 00 | 10 | 00 | 00 | 10 |
| VT5 | 00 | 00 | 10 | 10 | 10 | 10 | 10 | 10 |
| VD4 | 00 | 00 | 10 | 10 | 10 | 00 | 00 | 10 |
| VD3 | 01 | 01 | 00 | 00 | 00 | 00 | 00 | 00 |
表8 第二阶段补充变量i2故障编码表
Tab.8
| 故障管周期 | i2 | |||
|---|---|---|---|---|
| 变量 | T1 | T2 | T3 | T4 |
| 正常 | 10 | 00 | 01 | 00 |
| VT2 | 00 | 00 | 01 | 00 |
| VD1 | 00 | 00 | 01 | 01 |
| VT1 | 10 | 00 | 00 | 00 |
| VD2 | 10 | 10 | 00 | 00 |
5 实验
图6
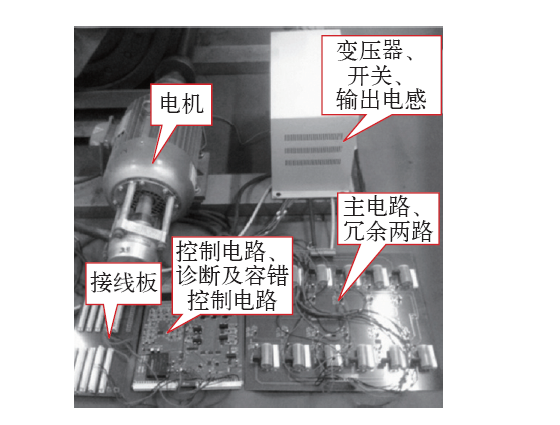
表9 原型机主要参数
Tab.9
| VT1〜VT6 | BTA16-600B |
|---|---|
| VD1〜VD4 | RHRP3060 |
| 75R/76R | RxQ-100-750ΩJ |
| 11L/12L | 0.028H |
| 变压器 | 220V/190V X2,其一带中间抽头 |
| 电机 | Z2-42(340V/4kW) |
图7
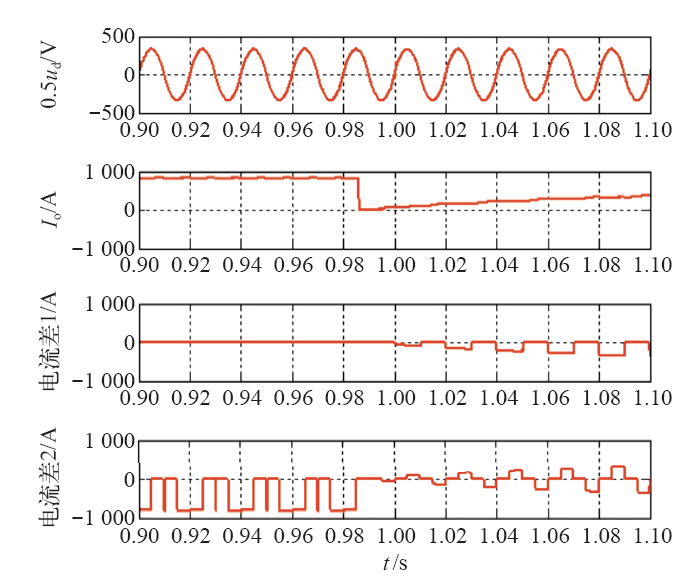
图8
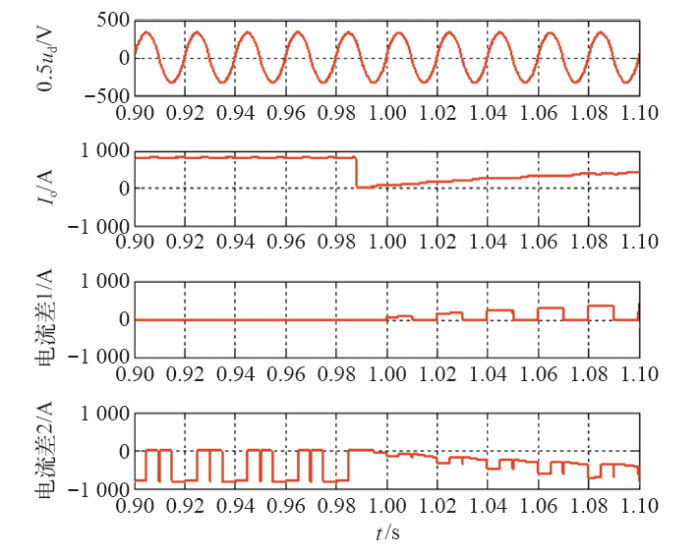
图9
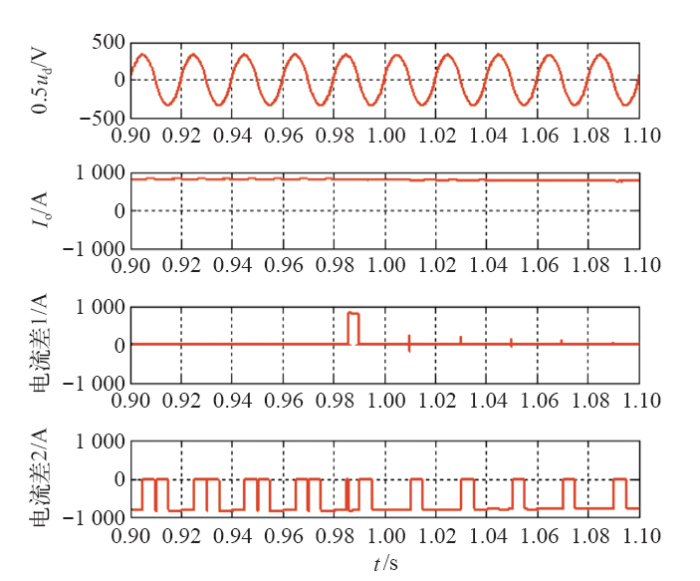
图10
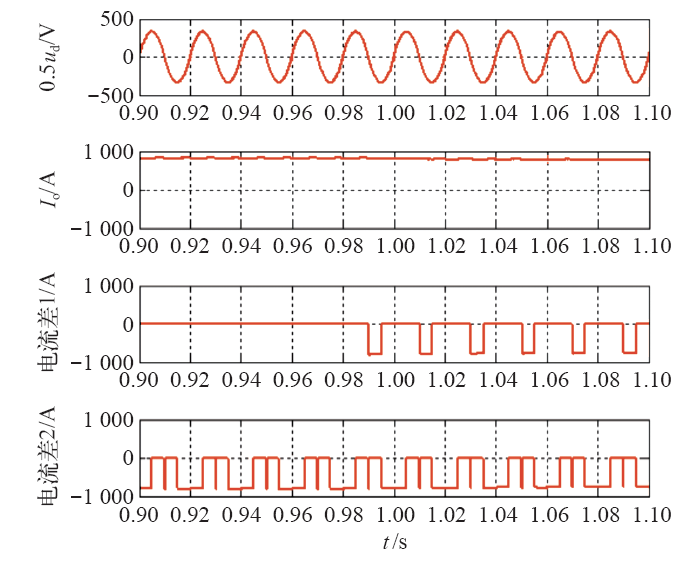
图11
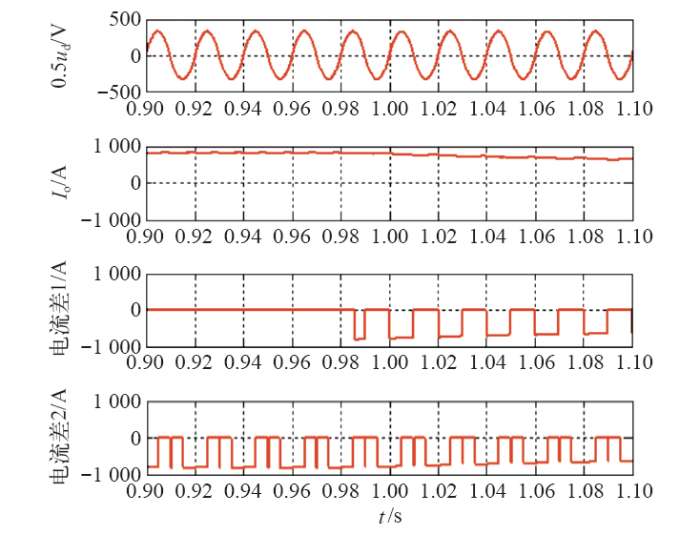
以上所有波形图中的信号分别代表a2x2上的电压ud2 = 0.5ud、输出电流io、电流差1δi、电流差2δi′。其中0.5ud用来确定波形所在时期。
由实验波形图可见,所有故障都可在两个周期内通过两个诊断信号检测出来并定位出故障管,本实验验证了此诊断方法的可行性。
6 结论
本文提出了一种牵引变流器故障直接诊断和定位的方法,并验证了其正确性和有效性。本方法能实现任一开关管开路故障的快速诊断和定位,诊断时间快;只需要两个电流传感器,电流传感器使用的是环形霍尔传感器,避免了提高系统的复杂度,且诊断变量为电流差值的极性,省去了繁复精确的计算过程并有效地避免了负载对电流的影响,同时通过一些简单的电路将诊断信号数字化,大大提高了牵引变流器可靠性及检修便捷性。但由于试验条件受限,无法在与实物完全一致的设备上进行测试,下一步希望能装车测试。
参考文献
开关磁阻电机功率变换器的故障诊断与容错策略
[J].功率变换器是开关磁阻电机系统的中枢执行机构, 也是系统中最容易出现故障的薄弱环节。本文分别从非线性模型仿真和实验两方面对不对称半桥功率变换器的单相故障进行了研究。基于傅里叶变换讨论了功率变换器故障后相电流频谱的变化规律, 提出了相对谱比系数的概念, 并将其作为故障特征量以实现功率变换器的故障检测。通过对比不同工况条件下的实验结果, 分析说明了相对谱比系数具有良好的鲁棒性。最后给出了一种变角度容错方案, 有效降低故障相产生的制动转矩, 提高系统的可靠性能。实验结果验证了该文故障诊断与容错方案的有效性。
Fault diagnosis and fault-tolerant control strategy for power converter of switched reluctance motor
[J].功率变换器是开关磁阻电机系统的中枢执行机构, 也是系统中最容易出现故障的薄弱环节。本文分别从非线性模型仿真和实验两方面对不对称半桥功率变换器的单相故障进行了研究。基于傅里叶变换讨论了功率变换器故障后相电流频谱的变化规律, 提出了相对谱比系数的概念, 并将其作为故障特征量以实现功率变换器的故障检测。通过对比不同工况条件下的实验结果, 分析说明了相对谱比系数具有良好的鲁棒性。最后给出了一种变角度容错方案, 有效降低故障相产生的制动转矩, 提高系统的可靠性能。实验结果验证了该文故障诊断与容错方案的有效性。
一种基于矢量控制的变流器故障诊断方法
[J].
An approach to converter faults diagnosis based on vector control
[J].
基于小波分析和SVM的主变流器故障诊断
[J].针对电力机车主变流器的故障,提出基于小波分析和支持向量机(SVM)的故障诊断方法.首先,运用小波包对特征信号进行分解和重构,然后提取各频带的能量,将得到的能量值构造为特征向量,最后把特征向量输入到支持向量机,进行故障诊断.MATLAB仿真结果表明,该方法能够准确地对故障进行诊断.
Fault diagnosis for main converter based on wavelet analysis and SVM
[J].针对电力机车主变流器的故障,提出基于小波分析和支持向量机(SVM)的故障诊断方法.首先,运用小波包对特征信号进行分解和重构,然后提取各频带的能量,将得到的能量值构造为特征向量,最后把特征向量输入到支持向量机,进行故障诊断.MATLAB仿真结果表明,该方法能够准确地对故障进行诊断.
Fault diagnosis digital method for power transistors in power converters of switched reluctance motors
[J].
DOI:10.1109/TIE.2012.2207661
URL
[本文引用: 1]

This paper describes four main fault types of the asymmetric bridge power converter in switched reluctance motor drive on power transistors. Two on-line fault diagnosis methods for power transistors in the power converter are proposed. The principle of the proposed diagnosis methods is to detect the real-time current state from some particular positions, and then obtain the diagnosis result and the fault location by logical judgment. One fault diagnosis method is proposed using single current sensor monitoring the chopped bus current; the other method is using dual current sensors scheme monitoring the upper freewheeling bus current and excitation bus current. The simulation results of current states from certain positions of a three-phase 12/8 motor and its power converter are analyzed. Experiments have verified the effectiveness of the proposed fault diagnosis methods. It is shown that the dual current sensors scheme monitoring the upper freewheeling bus current and excitation bus current has the fastest fault response.
Open-transistor fault diagnostics in voltage-source inverters by analyzing the load currents
[J].DOI:10.1109/TIE.2009.2023640 URL [本文引用: 1]
A new diagnostic technique for real-time diagnosis of power converter faults in switched reluctance motor drives
[C].
PWM-switching pattern-based diagnosis scheme for single and multiple open-switch damages in VSI-fed induction motor drives
[J].
DOI:10.1016/j.isatra.2011.10.012
URL
[本文引用: 1]
This paper deals with a fault detection technique for insulated-gate bipolar transistors (IGBTs) open-circuit faults in voltage source inverter (VSI)-fed induction motor drives. The novelty of this idea consists in analyzing the pulse-width modulation (PWM) switching signals and the line-to-line voltage levels during the switching times, under both healthy and faulty operating conditions. The proposed method requires line-to-line voltage measurement, which provides information about switching states and is not affected by the load. The fault diagnosis scheme is achieved using simple hardware and can be included in the existing inverter system without any difficulty. In addition, it allows not only accurate single and multiple faults diagnosis but also minimization of the fault detection time to a maximum of one switching period (T-c) Simulated and experimental results on a 3-kW squirrel-cage induction motor drive are displayed to validate the feasibility and the effectiveness of the proposed strategy. Crown Copyright (C) 2011 Published by Elsevier Ltd on behalf of ISA.
基于运行模式分析的逆变器功率管开路故障诊断方法
[J].提出一种新型逆变器功率管开路故障的在线诊断与定位方法。该方法在逆变器开关函数模型和运行模式分析的基础上,根据故障和正常状态下桥臂下管承受电压的不同,采用简单的硬件电路来实现,具有成本低、可靠性高、诊断时间短、适用性强等优点。对逆变器的运行模式进行研究,分别对正常状态和上下管开路故障状态时下管电压的实际值进行分析。分析结果表明,与由开关函数模型得到的下管电压估计值相比,上管和下管开路故障将产生不同的误差电压。另外,功率管开关延时、死区时间及测量噪声也会引起误差电压的产生,为了保障诊断的有效性需要加以消除。对于开关延时及测量噪声带来的误差电压,采用阈值比较和脉宽限制的方法将其滤除;同时通过将误差电压与开关信号进行调制,有效地消除了死区时间内的误差电压。给出硬件实现方法,在永磁同步电机矢量控制系统中进行实验验证。该方法不受闭环控制策略的影响,从表现出故障态到诊断输出的时间在10 ?m以内。
A novel diagnostic technique for open-switch faults of inverters based on operating mode analysis
[J].提出一种新型逆变器功率管开路故障的在线诊断与定位方法。该方法在逆变器开关函数模型和运行模式分析的基础上,根据故障和正常状态下桥臂下管承受电压的不同,采用简单的硬件电路来实现,具有成本低、可靠性高、诊断时间短、适用性强等优点。对逆变器的运行模式进行研究,分别对正常状态和上下管开路故障状态时下管电压的实际值进行分析。分析结果表明,与由开关函数模型得到的下管电压估计值相比,上管和下管开路故障将产生不同的误差电压。另外,功率管开关延时、死区时间及测量噪声也会引起误差电压的产生,为了保障诊断的有效性需要加以消除。对于开关延时及测量噪声带来的误差电压,采用阈值比较和脉宽限制的方法将其滤除;同时通过将误差电压与开关信号进行调制,有效地消除了死区时间内的误差电压。给出硬件实现方法,在永磁同步电机矢量控制系统中进行实验验证。该方法不受闭环控制策略的影响,从表现出故障态到诊断输出的时间在10 ?m以内。
无刷直流电机驱动系统逆变器的开路故障诊断
[J].逆变器的故障诊断是实现容错控制的前提,有助于提高电机驱动系统的可靠性。针对上桥臂PWM调制、下桥臂常开调制方式下的无刷直流电机驱动系统逆变器,提出了一种新颖的开路故障诊断方法。该方法将PWM周期内ON时的线电压与OFF时的线电压的差值作为特征量进行故障检测;在逆变器的下一工作模式中定位出具体的故障功率管。为了降低应用成本,提出了分时采集端电压来估计线电压差的软件算法与检测电路。最大诊断时间为1个电周期。该方法硬件电路简单、实现方便、可靠性高、成本低,且不受开环、闭环控制等策略的影响。实验结果表明了所提方法的正确性和有效性。
A diagnosis method for inverter open-circuit faults of brushless DC motor driver systems
[J].逆变器的故障诊断是实现容错控制的前提,有助于提高电机驱动系统的可靠性。针对上桥臂PWM调制、下桥臂常开调制方式下的无刷直流电机驱动系统逆变器,提出了一种新颖的开路故障诊断方法。该方法将PWM周期内ON时的线电压与OFF时的线电压的差值作为特征量进行故障检测;在逆变器的下一工作模式中定位出具体的故障功率管。为了降低应用成本,提出了分时采集端电压来估计线电压差的软件算法与检测电路。最大诊断时间为1个电周期。该方法硬件电路简单、实现方便、可靠性高、成本低,且不受开环、闭环控制等策略的影响。实验结果表明了所提方法的正确性和有效性。
Method for detecting an open-switch fault in a grid-connected NPC inverter system
[J].
DOI:10.1109/TPEL.2011.2178435
URL
[本文引用: 2]
This paper proposes a fault-detection method for an open-switch fault in the switches of grid-connected neutral-point-clamped inverter systems. The proposed method can not only detect the fault condition but also identify the location of the faulty switch. In the proposed method, which is designed by incorporating a simple switching control in the conventional method, the fault condition is detected on the basis of the radius of the Concordia current pattern, and the location of the faulty switch can be identified. By using the proposed method, it is possible to detect the open-switch fault and identify the faulty switch within two fundamental periods, without using additional sensors or performing complex calculations. Simulations and experiments are carried out to confirm the reliability of the proposed fault-detection method.
Open-circuit fault diagnosis in PMSG drives for wind turbine applications
[J].
DOI:10.1109/TIE.2012.2207655
URL
[本文引用: 2]
Condition monitoring and fault diagnosis are currently considered crucial means to increase the reliability and availability of wind turbines and, consequently, to reduce the wind energy cost. With similar goals, direct-drive wind turbines based on permanent magnet synchronous generators (PMSGs) with full-scale power converters are an emerging and promising technology. Numerous studies show that power converters are a significant contributor to the overall failure rate of modern wind turbines. In this context, open-circuit fault diagnosis in the two power converters of a PMSG drive for wind turbine applications is addressed in this paper. A diagnostic method is proposed for each power converter, allowing real-time detection and localization of multiple open-circuit faults. The proposed methods are suitable for integration into the drive controller and triggering remedial actions. In order to prove the reliability and effectiveness of the proposed fault diagnostic methods, several simulation and experimental results are presented.
