


1 引言
因此,本文从交通规划的角度进行考虑,提出了一种基于停车需求模型的电动汽车V2G放电负荷时空分布预测方法,建立了V2G负荷的时空分布模型,能直接利用交通规划报告中的数据,具有简单易用的特点,解决了当前研究缺少放电负荷分析的问题。
2 V2G负荷时空分布预测的总体思路
电动汽车作为一种交通工具,其时空分布很大程度上依赖于交通出行规律。因此,本文从交通出行的角度入手进行分析,以现有交通规划中的交通吸引量、土地利用等数据为基础,结合汽车行驶、停放特性,对电动汽车V2G负荷的时空分布进行预测,总体思路如图1所示。
图1
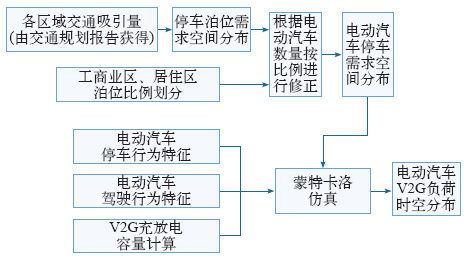
图1
V2G负荷时空分布预测总体思路
Fig.1
V2G load temporal and spatial distribution total prediction thinkway
首先将所研究的地区划分为不同的小区(每个小区作为空间上的最小单位),交通小区的划分一般遵循与城市行政区划分相一致、与自然隔阂(如河流、铁路等)相协调等原则[8]。根据各交通区域交通吸引量等数据,结合交通量—停车需求模型得到泊位需求的空间分布情况。然后结合各区域内工商业区和居住区的用地情况,以及电动汽车停车特性,得到电动汽车停车需求的时空分布模型。最后根据电动汽车驾驶行为特性以及V2G充放电容量计算模型,使用蒙特卡洛分析方法对各个区域电动汽车的行为以及V2G充放电过程进行仿真,从而最终得到V2G负荷的时空分布情况。
3 电动汽车停车需求空间分布模型
3.1 交通规划中的停车需求模型
要研究电动汽车V2G负荷大小,首先必须明确其停车分布。
停车需求预测、停车泊位规划是城市综合交通规划的重要内容。一般采用交通量—停车需求模型的一元对数回归进行表示[8],即
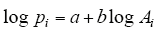
式中 pi——预测年第i个区域的日停车需求,单位:标准车车次;
Ai——预测年第i个区域的交通吸引量。
模型将整个地区按照一定的原则划分为不同的区域,实际上代表的是停车需求在空间上的分布情况。
式(1)中只有一个未知变量Ai,其计算虽然较为复杂,但一般可以直接从城市的综合交通规划报告中获得,因为交通出行量(包括发生量和吸引量)预测是城市交通规划不可或缺的一步。
3.2 停车泊位需求计算与区位划分
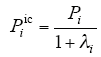
对于V2G来讲,其充放电设施的建设与停车泊位直接相关,所以还应当将3.1节的停车需求转化为停车泊位需求,泊位需求与停车需求存在一定的比例关系[9],即

式中 Pi——第i区停车泊位需求;
αi——第i区停车泊位周转率;
β——比例系数,通常取值为1.4~1.6。
式(2)表示的是停车泊位在空间上的分布情况。从后续分析可知,在工商业区泊位和居民区泊位,汽车的停放特性是不一样的。根据用地性质的不同,式(2)中的各区域可以分为两类:①工商业区,包括工业、商业、公共设施、仓储以及市政用地等;②居民区,即居住用地。两类泊位数量比可以根据用地面积和泊位配建比进行估算[6],即
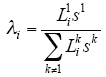
式中 Lik——第i区k类用地面积,k=1表示居住
用地,单位:m2;
sk——第i区k类用地泊位配建比,单位:个/
100m2。
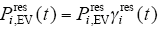
因此,第i个区域居住区泊位和工商业区泊位需求量分别可表示为
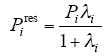
其中,上标“res”表示居住区,“ic”表示工商业区。
4 电动汽车停车需求时间特性分析
按照停车地点划分,可以将停车分为两种类型[10]:非居住区停车和居住区停车。不同区域的停车行为呈现出不同的特点。
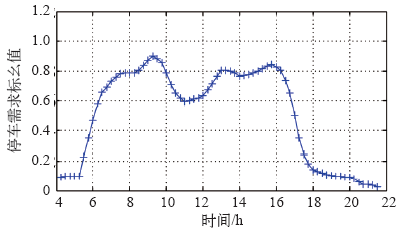
4.1 非居住区停车需求时间特性
非居住区的停车需求一般由上班、上学、购物等出行产生,停车地点多处于工业或者商业区。在工作日,上班、上学出行占大部分,此类停车时间较长,一般为4~8 h,由于加班等原因停车时长可能会更长。
图2
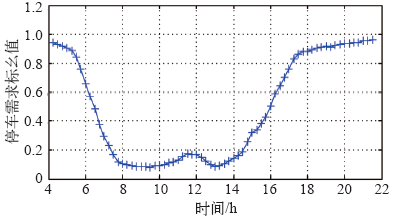
4.2 居住区停车需求时间特性
图3
4.3 停车需求时空分布模型
停车需求空间分布描述的是停车高峰需求。本文采用标幺值函数γires(t)和γiic(t)来描述停车需求的时间分布特性,即
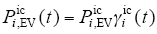
式中 γires(t)——第i区域居住区停车需求随时间的
变化值;
γiic(t)——第i区域工商业区停车需求随时间
的变化值。
5 V2G负荷容量模型及预测方法
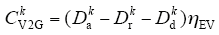
5.1 电动汽车V2G负荷容量模型
V2G负荷容量大小与其储能电池的荷电状态(SOC)直接相关,SOC计算式为

式中 t0——电动汽车到达停车地点的时刻;
Pcharger——充放电功率,单位:kW;
ηch——充放电效率;
Ebat——电池标称容量;
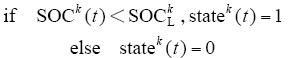
state(t)——充放电状态函数,state(t) = 1,-1,0,
1表示充电,–1表示放电,0表示
不充不放。
(1)充电负荷容量。当电池SOC低于充电阈值SOCLk时(k表示第k辆车),会产生充电需求。充电阈值由用户根据需要进行设定,其值一般与停车时刻有关,白天时电价较高,用户会将充电阈值设置稍低一些,晚上电价较低,则充电阈值设置会较高。第i个区域充电负荷容量计算式为

式中 
约束条件
因此,在整个放电过程中必须保证放电的总容量不能超过可用V2G容量,第i区域放电负荷容量计算式为
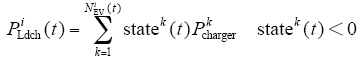
约束条件
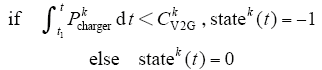
其中,t1表示放电起始时刻。
图4
5.2 基于蒙特卡洛仿真的V2G负荷预测
利用蒙特卡洛仿真预测V2G负荷的流程如图5所示。本文将一天24h分成96个时段,每隔15min对V2G负荷进行统计。
图5
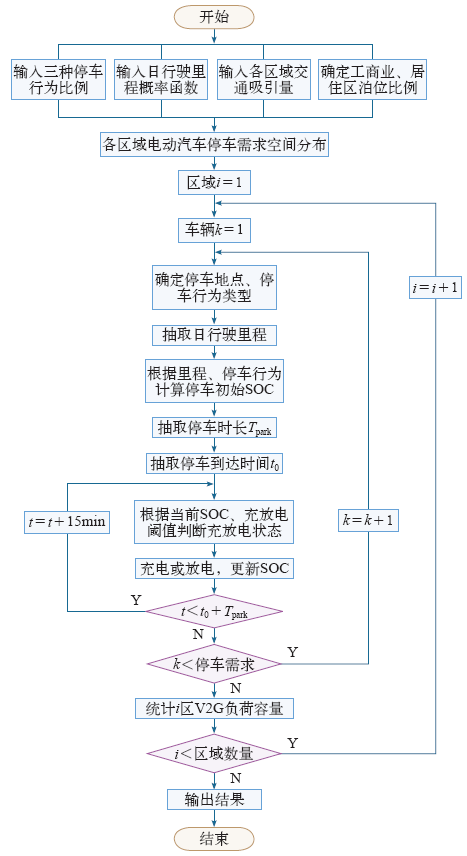
图5
基于蒙特卡洛仿真的V2G负荷时空分布预测流程
Fig.5
V2G load temporal and spatial distribution prediction flow based on Monte Carlo simulation
首先输入区域交通量(在城市交通规划报告中可找到)、电动汽车日出行特性等相关数据,确定停车需求在各个区域内的空间分布情况。然后针对各个区域,按概率分布抽取相应的信息进行蒙特卡洛仿真,从而产生电动汽车V2G负荷的时空分布预测值。
如当i=1,首先抽取第一辆汽车k=1,确定该汽车处于工商业区还是居住区,然后抽取日行驶里程,并根据日行驶里程计算初始SOC。继而抽取到达时间以及停车时长,根据当前的SOC充放电阈值判断充放电状态statek(t),并实施充放电更新SOC,直至t<t0 + Tpark。当区域i中所有电动汽车计算完毕后,根据式(9)、式(10)对充放电负荷进行统计。
6 算例分析
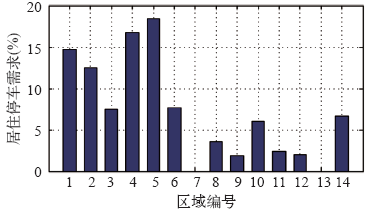
6.1 停车需求的空间分布
图6
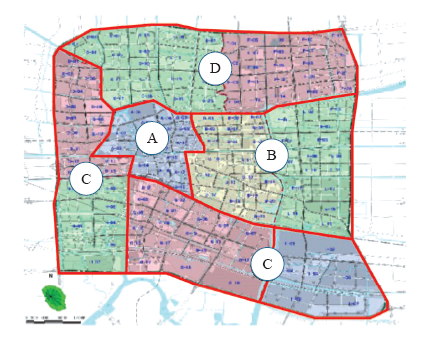
表 各区域停车泊位需求计算结果
Tab.
| 大区域 | 区域编号 | 泊位需求数量 | 居住区、工商业区泊位比 |
|---|---|---|---|
| A | 1 | 1 303 | 1.6 |
| 2 | 1 100 | 1.6 | |
| 3 | 1 087 | 0.6 | |
| 4 | 1 561 | 1.4 | |
| 5 | 1 371 | 2.7 | |
| B | 6 | 1 017 | 0.7 |
| 7 | 202 | 0.0 | |
| 8 | 667 | 0.4 | |
| 9 | 607 | 0.2 | |
| C | 11 | 383 | 0.5 |
| 12 | 624 | 0.2 | |
| 13 | 172 | 0.0 | |
| D | 14 | 548 | 1.9 |
| 10 | 1 957 | 0.2 |
图7
6.2 V2G负荷分析
假设该城市电动汽车总量为10 000辆,汽车日行驶里程服从对数正态分布,日行驶里程不超过电动汽车续航能力,平均行驶速度取25km/h。以工作日为例进行仿真,用户早上以满电状态(SOC>0.95)离家。根据用户的行为特性[11],假设到达工作地点的时刻服从正态分布N(7.5, 0.8),回到居住地的时刻服从N(17.5, 0.8)。
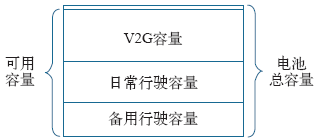
假定在工商业区,汽车一直停放至下午,平均停车时长为10h。在居住区,夜间平均停车时长为11h。停车时初始SOC由日行驶里程决定,假设上午到达时已消耗日行驶里程的1/2,晚上到家时日行驶里程全部用完。大多数用户选择夜间充电,白天放电的工作模式,备用行驶容量取为总容量的20%,Ebat = 24kW·h,ηEV = 24kW·h/160km,Da = 160km。
在实施V2G放电时,为了达到调峰填谷的目的,本文中控制放电时段对应有两个用电高峰9:00~12:00和19:00~22:00,每个时段各放出可用V2G容量的50%。23:00以后进行夜间充电。
6.2.1 不同备用行驶容量下的V2G负荷
图8分别给出了工商业区和居住区的日V2G负荷情况(正值表示V2G放电,负值表示充电),假定单辆汽车充、放电功率均为3.3kW,备用行驶容量分别取0%、20%和40%。
图8
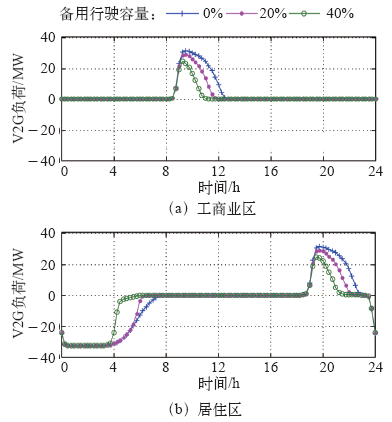
可以看到,白天V2G放电负荷主要由工商业区产生,夜间充放电负荷则主要发生在居住区。备用行驶容量取值越大,电动汽车所能提供的V2G放电负荷越大,相应地夜间充电负荷持续时间越长。值得注意的是,在夜间充电过程中,备用0%和备用20%的持续时间差别不是很大,这主要是由于充电功率较低所致,还未充满电池便已离开。
6.2.2 不同充放电功率下的V2G负荷
V2G负荷的大小还与单台车的充放电功率大小有关,图9给出了不同充放电功率下日V2G负荷情况,单台车充放电功率分别取为3kW、5kW、7kW,备用行驶容量取总容量的20%。可以看到,随着充放电功率的增加,V2G充放电负荷逐渐增加,当充放电功率取7kW时,负荷容量可达55MW,但由于汽车总可用放电容量一定,大放电功率会导致放电持续时间减少,所以在放电持续时间要求较高的场合,宜选用较小的充放电功率。
图9
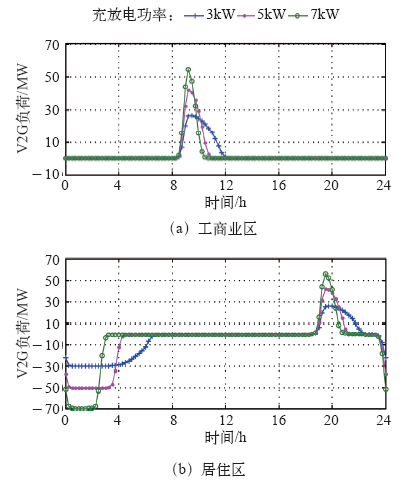
图9
不同充放电功率时的V2G 负荷
Fig.9
V2G load capacity with different charging or discharging power
值得注意的是,图9中放电峰值时刻与典型日负荷曲线峰值可能并不一致,原因在于本文只采用了简单的V2G控制策略:汽车只要在规定放电时段存在可用功率便可以放电。所以在V2G过程中,必须根据当前可用V2G容量对放电过程加以合理控制,如果任由汽车随意放电的话,很可能导致V2G无法起到调峰的作用。
6.2.3 不同日均行驶里程下的V2G负荷
城市大小、路况以及人们生活习惯的不同会导致电动汽车的日平均行驶里程有所差异。对于较大城市,汽车日均行驶里程在40~50km之间,而较小城市一般在20~30km范围内。图10给出了不同的日均行驶里程对于V2G负荷的影响。日均行驶里程分别取为20km、30km、50km,备用行驶容量取为总容量的20%。
图10
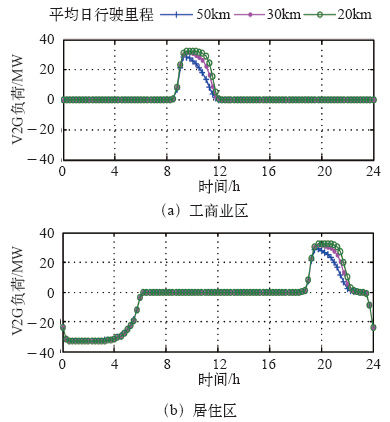
图10
不同日平均行驶里程下的V2G负荷
Fig.10
V2G load with different average daily driving range
从图10可以看到,当日平均行驶里程为20km时,V2G放电负荷曲线持续时间较长,且总放电功率峰值较为稳定,当日平均行驶里程为30km时,V2G总放电功率峰值略有下滑,而当日均行驶里程为50km时,V2G总放电功率持续时间明显变短,且峰值有较大下滑。在上述三种情况下,采用相同的备用行驶容量,所以夜间的充电负荷基本一致。
6.2.4 各个大区域的V2G负荷分析
为了分析方便,本文将上表中的14个区域合并为4个大区域:A、B、C、D。其中,A、D为城区,人口密度较大,商贸较为发达;B、C为开发区,居住人口较少,但工业比较发达。工作日4个大区域V2G负荷预测如图11所示。
图11
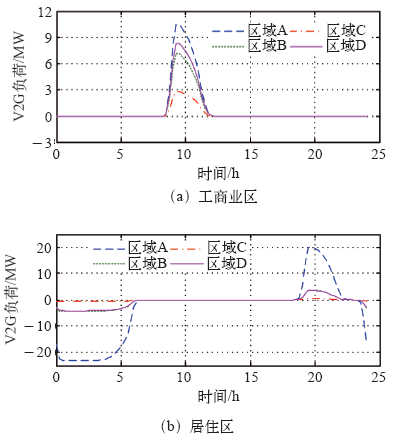
可以看到,不同区域内V2G负荷差异较大,A区内无论是工商业区还是居住区的V2G负荷均高于其他区域,相应的夜间充电负荷也最高。C区是V2G负荷最低的区域。对于同一区域,由于其发展侧重不同,工商业区和居住区的V2G也有所不同。由于A区内居住区停车需求要高于工商业区,所以相应的居住区的V2G负荷也高于工商业区;D区与A区相反,以工商区V2G负荷为主。而B、C区为开发区,以工业为主,所以其居住区的V2G负荷远低于工商业区。
7 结论
本文针对城市电动汽车行驶停放的不确定性,研究了电动汽车群体V2G负荷时空分布的预测问题,提出了电动汽车V2G负荷时空分布的预测方法,主要工作与结论如下:
(1)从交通规划的角度入手,建立了电动汽车停车需求在空间上的分布模型,并考虑了工商业区和居住区停车的差异性。该模型可以直接采用现有交通规划报告中的相关数据,具有简单、易于使用的特点。
(2)建立了电动汽车V2G负荷容量模型,结合电动汽车行驶及停车的时空分布特性,给出了基于蒙特卡洛仿真的电动汽车V2G负荷时空分布的预测方法。
(3)以某市市区为例,对所提出的V2G负荷预测方法进行了仿真,V2G负荷模型和预测方法的应用为充放电设施规划和对充放电控制策略的研究奠定了基础。
参考文献
电动汽车V2G技术综述
[J].
Review of electric vehicle V2G technology
[J].
Vehicle-to-grid power implementation: from stabilizing the grid to supporting large-scale renewable energy
[J].DOI:10.1016/j.jpowsour.2004.12.022 URL [本文引用: 1]
Plug-in vehicles and renewable energy sources for cost and emission reductions
[J].
Assessment of the impact of plug-in electric vehicles on distribution networks
[J].
DOI:10.1109/TPWRS.2010.2049133
URL
[本文引用: 1]

Plug-in electric vehicles (PEVs) present environmental and energy security advantages versus conventional gasoline vehicles. In the near future, the number of plug-in electric vehicles will likely grow significantly in the world. Despite the aforementioned advantages, the connection of PEV to the power grid poses a series of new challenges for electric utilities. This paper proposes a comprehensive approach for evaluating the impact of different levels of PEV penetration on distribution network investment and incremental energy losses. The proposed approach is based on the use of a large-scale distribution planning model which is used to analyze two real distribution areas. Obtained results show that depending on the charging strategies, investment costs can increase up to 15% of total actual distribution network investment costs, and energy losses can increase up to 40% in off-peak hours for a scenario with 60% of total vehicles being PEV.
Spatial and temporal model of electric vehicle charging demand
[J].
DOI:10.1109/TSG.2011.2159278
URL
[本文引用: 2]
This paper presents a spatial and temporal model of electric vehicle charging demand for a rapid charging station located near a highway exit. Most previous studies have assumed a fixed charging location and fixed charging time during the off-peak hours for anticipating electric vehicle charging demand. Some other studies have based on limited charging scenarios at typical locations instead of a mathematical model. Therefore, from a distribution system perspective, electric vehicle charging demand is still unidentified quantity which may vary by space and time. In this context, this study proposes a mathematical model of electric vehicle charging demand for a rapid charging station. The mathematical model is based on the fluid dynamic traffic model and the M/M/s queueing theory. Firstly, the arrival rate of discharged vehicles at a charging station is predicted by the fluid dynamic model. Then, charging demand is forecasted by the M/M/s queueing theory with the arrival rate of discharged vehicles. This mathematical model of charging demand may allow grid's distribution planners to anticipate a charging demand profile at a charging station. A numerical example shows that the proposed model is able to capture the spatial and temporal dynamics of charging demand in a highway charging station.
考虑时空分布的电动汽车充电负荷预测方法
[J].
DOI:10.7500/AEPS20130613009
URL
[本文引用: 2]
A new method of predicting the electric vehicle(EV)charging load considering the spatial and temporal distribution is proposed based on driving and parking characteristics of private cars.The parking demand is predicted with the parking generation rate model and the spatial and temporal distribution model of EV parking demand is developed by integrating various parking demands and characteristics in different types of areas.Then,EV charging demands are analyzed based on the daily driving mileages and the spatial and temporal distribution characteristics of daily parking demands.The Monte Carlo simulation method is adopted to simulate EV parking,driving and charging behavior sat different time and different places for the prediction of the spatial and temporal distribution characteristics of EV charging load.The predicted outcomes of Shenzhen in2020show that EV charging load changes with different charging behaviors and charging facilities available;charging demands can be mostly satisfied with charging facilities at residential quarters and workplaces;charging loads in different parts of a city with different pieces of land for construction are markedly different.
A prediction method for electric vehicle charging load considering spatial and temporal distribution
[J].
DOI:10.7500/AEPS20130613009
URL
[本文引用: 2]
A new method of predicting the electric vehicle(EV)charging load considering the spatial and temporal distribution is proposed based on driving and parking characteristics of private cars.The parking demand is predicted with the parking generation rate model and the spatial and temporal distribution model of EV parking demand is developed by integrating various parking demands and characteristics in different types of areas.Then,EV charging demands are analyzed based on the daily driving mileages and the spatial and temporal distribution characteristics of daily parking demands.The Monte Carlo simulation method is adopted to simulate EV parking,driving and charging behavior sat different time and different places for the prediction of the spatial and temporal distribution characteristics of EV charging load.The predicted outcomes of Shenzhen in2020show that EV charging load changes with different charging behaviors and charging facilities available;charging demands can be mostly satisfied with charging facilities at residential quarters and workplaces;charging loads in different parts of a city with different pieces of land for construction are markedly different.
基于出行目的停车行为差异性分析
[J].
Variation analysis of parking behaviors with different travel purposes
[J].
Modeling and impact analysis of large scale V2G electric vehicles on the power grid
[C].
